“Instrumentation” is one of those words that gets thrown around constantly in the observability world - but what does it actually mean, and how does it work in practice? I’ve run this as a hands-on workshop several times, and what I find most effective is starting from first principles: build a tiny app, make it produce telemetry, and watch what comes out. By the end you understand why the pieces fit together the way they do.
This post follows that same path. We’ll build a minimal Python Flask app, instrument it in three progressively deeper ways, and look at the results in New Relic. Everything here applies equally to any OTLP-compatible backend - New Relic is just what I use.
What instrumentation actually means
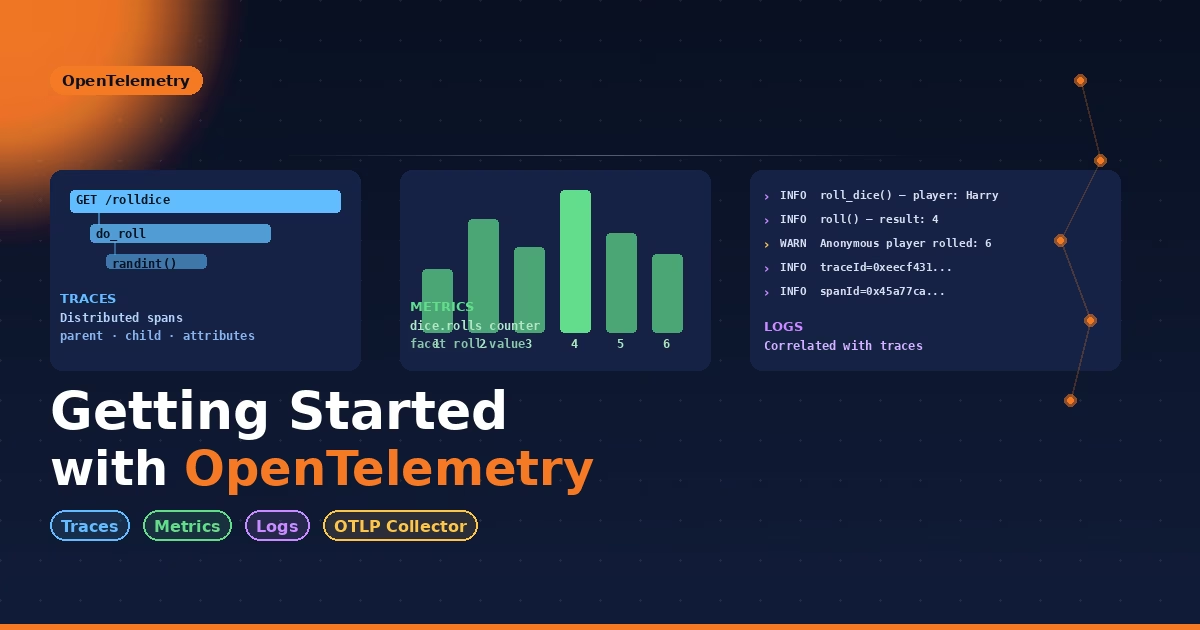
Instrumentation is the act of adding telemetry-producing code to an application. That telemetry comes in three forms - the three signals of OpenTelemetry:
- Traces - records of work done by your application, structured as spans that capture operation names, timestamps, durations, and key-value attributes. Spans link together into trees to show the full path of a request.
- Metrics - numerical measurements over time: counters, gauges, histograms. These answer questions like “how many requests per second?” and “what’s the 99th-percentile latency?”
- Logs - timestamped text records, correlated with traces so you can jump from a slow span to the log lines that surrounded it.
What makes OpenTelemetry powerful is that it separates producing telemetry from shipping it. Your application emits signals using a vendor-neutral API; where those signals end up is a configuration concern, not a code concern.
The sample application: a dice roller
We need an app simple enough to fit in one file but realistic enough to illustrate real instrumentation patterns. A Flask endpoint that rolls a dice does the job:
mkdir otel-web-flask && cd otel-web-flask
python3 -m venv venv && source ./venv/bin/activate
pip install 'flask<3' 'werkzeug<3'
# app.py
from random import randint
from flask import Flask

app = Flask(__name__)

@app.route("/rolldice")
def roll_dice():
    return str(do_roll()) + "\r\n"

def do_roll():
    return randint(1, 6)
flask run -p 8080
curl http://localhost:8080/rolldice
# → 4
It works. Now let’s make it observable.
Step 1: Zero-code instrumentation
The fastest way to add OpenTelemetry to an existing Python application is zero-code instrumentation - no changes to app.py required. Install the distro package and run the bootstrap tool:
pip install opentelemetry-distro
opentelemetry-bootstrap -a install
opentelemetry-bootstrap scans your installed packages and automatically installs the matching instrumentation libraries. Because Flask is installed, it pulls in opentelemetry-instrumentation-flask. This library uses monkey patching to wrap Flask’s request handling at runtime - your code is unchanged, but every inbound HTTP request now produces a span.
Set your service name and run the instrumented app, exporting to the console first:
export OTEL_SERVICE_NAME=otel-web-flask

opentelemetry-instrument \
    --traces_exporter console \
    --metrics_exporter console \
    --logs_exporter console \
    flask run -p 8080
Send a few requests and you’ll see spans printing to the terminal:
{
    "name": "GET /rolldice",
    "context": {
        "trace_id": "0xeecf43148124bd0838b86cec63d23642",
        "span_id": "0x45a77ca1dd8476ac"
    },
    "kind": "SpanKind.SERVER",
    "attributes": {
        "http.method": "GET",
        "http.route": "/rolldice",
        "http.status_code": 200
    }
}
Why export to the console first? It’s the fastest feedback loop. You can see exactly what OpenTelemetry is capturing before committing to a backend. Once you understand the shape of the data, pointing it somewhere useful is just a flag change.
Step 2: Sending telemetry to New Relic via OTLP
New Relic exposes a native OTLP endpoint - you point the exporter at it with an API key header and data flows in without any agent or proprietary SDK. Install the OTLP exporter:
pip install opentelemetry-exporter-otlp
pip install opentelemetry-exporter-otlp-proto-grpc
Configure the endpoint and credentials as environment variables (the opentelemetry-instrument agent picks these up automatically):
export NEW_RELIC_LICENSE_KEY=your_key_here

# US region
export OTEL_EXPORTER_OTLP_ENDPOINT=https://otlp.nr-data.net:4317
export OTEL_EXPORTER_OTLP_HEADERS="api-key=$NEW_RELIC_LICENSE_KEY"

# EU region (if applicable)
# export OTEL_EXPORTER_OTLP_ENDPOINT=https://otlp.eu01.nr-data.net:4317
Switch the exporters from console to otlp and run:
opentelemetry-instrument \
    --traces_exporter otlp \
    --metrics_exporter otlp \
    --logs_exporter otlp \
    flask run -p 8080
Generate some load with ApacheBench:
ab -n 5000 -c 3 http://localhost:8080/rolldice
In New Relic under APM & Services → otel-web-flask, you’ll see the service appear with its standard APM summary view - throughput, response time, error rate - all derived from the trace and metric data your app is now shipping. Under Distributed Tracing you can drill into individual traces, see the GET /rolldice span, and inspect its attributes.
One service, one endpoint, zero proprietary code.
Step 3: Custom instrumentation for all three signals
Zero-code instrumentation captures what happens at the edges of your application - inbound HTTP, outbound database calls, and so on. It doesn’t know what’s happening inside your business logic. That’s where manual instrumentation comes in.
Custom traces: child spans and attributes
Acquire a tracer and use it to wrap the do_roll function in its own span:
from opentelemetry import trace
from random import randint
from flask import Flask

tracer = trace.get_tracer("diceroller.tracer")
app = Flask(__name__)

@app.route("/rolldice")
def roll_dice():
    return str(do_roll()) + "\r\n"

def do_roll():
    with tracer.start_as_current_span("do_roll") as rollspan:
        res = randint(1, 6)
        rollspan.set_attribute("roll.value", res)
        return res
Now every request produces two spans: the auto-instrumented GET /rolldice span from Flask, and a child do_roll span from your code. The child span carries a custom roll.value attribute - the actual number rolled. You can query, filter, and alert on that attribute in any OTLP-compatible backend.
The parent-child relationship is automatic: start_as_current_span reads the active span context and links the new span to it. You don’t manage trace IDs manually.
Custom metrics: a counter with dimensions
from opentelemetry import trace, metrics
from random import randint
from flask import Flask

tracer = trace.get_tracer("diceroller.tracer")
meter = metrics.get_meter("diceroller.meter")

roll_counter = meter.create_counter(
    "dice.rolls",
    description="The number of rolls by roll value",
)

app = Flask(__name__)

@app.route("/rolldice")
def roll_dice():
    return str(do_roll()) + "\r\n"

def do_roll():
    with tracer.start_as_current_span("do_roll") as rollspan:
        res = randint(1, 6)
        rollspan.set_attribute("roll.value", res)
        roll_counter.add(1, {"roll.value": res})
        return res
roll_counter.add(1, {"roll.value": res}) increments the counter with a dimension - the value rolled. After running for a while you can query the distribution in New Relic with NRQL:
SELECT count(`dice.rolls`)
FROM Metric
WHERE `dice.rolls` IS NOT NULL
SINCE 30 minutes ago
FACET roll.value
This gives you a breakdown of how many times each number was rolled - a trivial example, but the pattern applies to anything: queue depth by queue name, cache misses by cache key, error counts by error type.
Custom logs: correlated with traces
from opentelemetry import trace, metrics
from random import randint
from flask import Flask, request
import logging

tracer = trace.get_tracer("diceroller.tracer")
meter = metrics.get_meter("diceroller.meter")
roll_counter = meter.create_counter("dice.rolls", description="The number of rolls by roll value")

app = Flask(__name__)
logging.basicConfig(level=logging.INFO)
logger = logging.getLogger(__name__)

@app.route("/rolldice")
def roll_dice():
    with tracer.start_as_current_span("roll") as roll_span:
        player = request.args.get("player", default=None, type=str)
        result = randint(1, 6)
        roll_span.set_attribute("roll.value", result)
        roll_counter.add(1, {"roll.value": result})
        if player:
            logger.info("%s is rolling the dice: %s", player, result)
        else:
            logger.warning("Anonymous player is rolling the dice: %s", result)
        return str(result) + "\r\n"
With --logs_exporter otlp, the OpenTelemetry SDK automatically injects the current trace ID and span ID into every log record. In New Relic you can open any trace, click the Logs tab, and see the log lines that were emitted during that specific span - without writing any correlation code yourself. This is logs-in-context, and it’s one of the most practically useful things OpenTelemetry gives you.
Step 4: The OpenTelemetry Collector
So far the application has been exporting directly to New Relic’s OTLP endpoint. That works, but it has a hard coupling: your app knows it’s talking to New Relic. If you want to change backends, add a second backend, enrich telemetry before export, or fan out to different destinations, you need to change the application.
The OpenTelemetry Collector breaks that coupling. It’s a standalone process that sits between your application and any backend. Your app exports to the collector; the collector does whatever you configure.
The receiver → processor → exporter pipeline
The collector is built around a three-stage pipeline:
Application → [Receiver] → [Processor(s)] → [Exporter] → Backend
- Receivers accept telemetry from one or more sources (OTLP gRPC, OTLP HTTP, Prometheus, Jaeger, and many more)
- Processors transform data in flight - batching, filtering, enriching, sampling
- Exporters forward data to one or more backends
Here’s a minimal config.yaml that demonstrates all three, including a real-world use case for the resource processor: stamping every span, metric, and log with a custom attribute:
receivers:
  otlp:
    protocols:
      grpc:
        endpoint: 0.0.0.0:4317
      http:
        endpoint: 0.0.0.0:4318

processors:
  batch:
  resource:
    attributes:
      - key: environment
        value: workshop
        action: insert

exporters:
  otlp_grpc:
    endpoint: https://otlp.nr-data.net:4317   # New Relic US
    headers:
      api-key: YOUR_NEW_RELIC_LICENSE_KEY

service:
  pipelines:
    traces:
      receivers: [otlp]
      processors: [resource, batch]
      exporters: [otlp_grpc]
    metrics:
      receivers: [otlp]
      processors: [resource, batch]
      exporters: [otlp_grpc]
    logs:
      receivers: [otlp]
      processors: [resource, batch]
      exporters: [otlp_grpc]
Run the collector in Docker:
docker pull ghcr.io/open-telemetry/opentelemetry-collector-releases/opentelemetry-collector:0.147.0

docker run -p 4317:4317 -p 4318:4318 \
  -v ./config.yaml:/etc/otelcol/config.yaml \
  ghcr.io/open-telemetry/opentelemetry-collector-releases/opentelemetry-collector:0.147.0
Point the application at the collector instead of New Relic directly:
export OTEL_EXPORTER_OTLP_ENDPOINT=http://127.0.0.1:4317

opentelemetry-instrument \
    --traces_exporter otlp \
    --metrics_exporter otlp \
    --logs_exporter otlp \
    flask run -p 8080
The application is now backend-agnostic. To add a second export destination, change a line in config.yaml - not a line in your application code.
To verify the resource processor is working, open a trace in New Relic and inspect the span attributes: you’ll see the environment: workshop attribute (or whatever you configured) on every span, even though the application code never set it.
Putting it together
Here’s what the four steps achieve and why each layer matters:
| Step | What it gives you | Code changes |
|---|---|---|
| Zero-code instrumentation | HTTP traces and standard metrics automatically | None |
| Direct OTLP export | Telemetry flowing to a real backend | None (env vars only) |
| Custom instrumentation | Business-logic spans, dimensional metrics, correlated logs | App code |
| OTel Collector | Backend portability, enrichment, fan-out | Config file only |
Most teams should aim for steps 1 and 2 first - auto-instrumentation covers a surprising amount of ground and gets you APM-quality data with no code changes. Step 3 is worth it for any logic that isn’t covered by a library (your service layer, your domain logic, your background jobs). Step 4 becomes important the moment you have more than one backend, need to add custom attributes centrally, or want sampling without touching application code.
You’ll need a free New Relic account to follow the OTLP export steps.