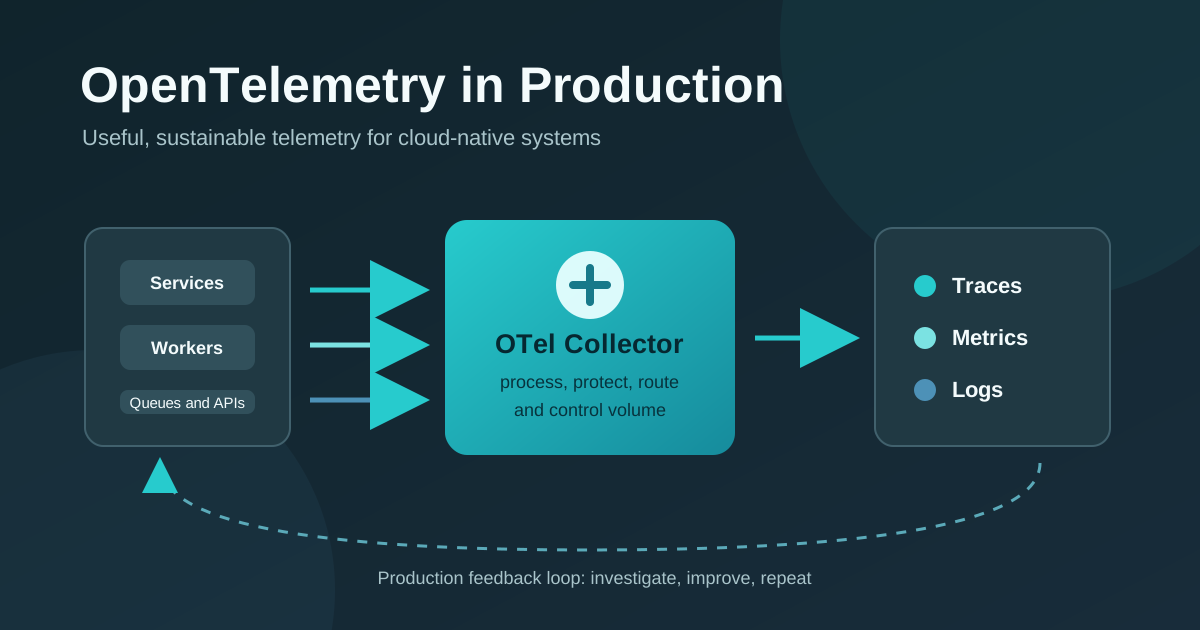
OpenTelemetry is not valuable because it produces more telemetry. It is valuable when it helps an engineer answer a production question quickly: what changed, who is affected, where did the request fail, and what should happen next?
This guide is a practical starting point for teams moving from basic instrumentation to an observability practice that is useful, affordable, and sustainable.
Who this is for
This is for software engineers, platform teams, and SREs running distributed applications. It assumes you want vendor-neutral instrumentation and an operational model that works across services, languages, and deployment environments.
Start with decisions, not dashboards
Before adding an SDK or Collector, identify the decisions telemetry must support:
- Detect whether a service is healthy and whether users are affected.
- Diagnose a failed or slow request across service boundaries.
- Understand the dependency, deployment, tenant, or feature flag involved.
- Decide when an alert needs human action and when it does not.
Those questions determine the signals, attributes, retention, and alerts worth paying for. A dashboard without a decision behind it is usually just an expensive status display.
Instrument the signals that explain behavior
Use traces, metrics, and logs together, with a clear responsibility for each:
| Signal | Use it to answer | Production guidance |
|---|---|---|
| Traces | Where did this request spend time or fail? | Propagate context across every synchronous and asynchronous boundary. |
| Metrics | Is this service healthy over time? | Favor stable, low-cardinality service-level indicators for alerting. |
| Logs | What detailed evidence explains this event? | Emit structured fields and correlate them to traces. |
Start with automatic instrumentation to establish a baseline, then add manual spans and business attributes around the work that automatic instrumentation cannot understand. Good manual instrumentation names meaningful operations, records failures, and adds context that explains the user-visible outcome.
For a concrete example of the trade-off, see Kafka tracing with automatic and manual instrumentation.
Treat context propagation as a product requirement
Distributed traces are only useful when the important work remains connected. Verify propagation through HTTP and gRPC calls, message queues, scheduled jobs, background workers, and browser-to-backend requests.
For asynchronous systems, record enough context to understand the producer, consumer, topic or queue, retry behavior, and processing result. A trace that stops at a message broker turns an operational question into a manual investigation.
Design attributes deliberately
Attributes make telemetry searchable, but every new attribute has a cost and privacy implication. Establish a shared convention for:
- Service name, service version, environment, deployment, and cloud region.
- Tenant, feature, or workflow identifiers that explain behavior without exposing personal data.
- Error type and outcome fields that make failures groupable.
- Domain-specific identifiers only where they answer a recurring operational question.
Avoid putting high-cardinality values, secrets, tokens, or raw personal data into metric labels. Use trace and log attributes selectively, with redaction and retention policies that your team can explain and enforce.
Put the Collector in charge of delivery
Use the OpenTelemetry Collector to centralize processing that should not be duplicated across every application:
- Batch, retry, and route telemetry to the appropriate backend.
- Filter or redact sensitive fields before export.
- Apply sampling rules that preserve failures and slow requests.
- Enrich records with environment or infrastructure context.
- Export to one or more destinations without changing application instrumentation.
Keep application code responsible for creating high-quality telemetry; keep the Collector responsible for transport, policy, and operations.
Control volume before it controls your bill
Telemetry cost is an architecture concern. Measure ingestion volume, identify the services and attributes producing it, and make conscious trade-offs:
- Keep unsampled errors and slow traces.
- Sample high-volume successful traffic at a rate that still supports diagnosis.
- Aggregate metrics for alerting instead of deriving every alert from logs or traces.
- Set retention according to the investigation and compliance need.
- Review the value of every expensive attribute and event type.
The goal is not to capture everything forever. It is to retain the evidence needed to make reliable decisions.
Close the loop with actionable operations
An instrumented system becomes observable only when the team uses the data to change its decisions. Review incident timelines, recurring alerts, slow traces, and expensive telemetry regularly. Then improve instrumentation, runbooks, service objectives, and ownership based on what those reviews reveal.
For event design that serves both diagnosis and analytics, see OpenTelemetry Events vs. New Relic Custom Events. If you are building distributed .NET applications, the .NET Aspire eShop telemetry walkthrough shows how service-level configuration carries telemetry to an OpenTelemetry backend.
Production readiness checklist
Before calling an OpenTelemetry rollout complete, verify that:
- A real user journey creates a continuous trace across services and asynchronous boundaries.
- Engineers can find a trace from an alert, log entry, or support identifier.
- Service names, environments, and versions follow one convention.
- Sensitive data is redacted before export and access is appropriately controlled.
- Sampling and retention policies are documented and measured.
- Alerts map to a user or service objective and include an owner and response path.
- Dashboards answer named operational questions instead of collecting every available chart.
Next steps
Pick one high-value user journey and instrument it end to end. Review the resulting trace with the team that supports it, record what is missing or noisy, and improve the telemetry before expanding to the next service. This small feedback loop produces more durable observability than a large, one-time instrumentation project.