Below you will find pages that utilize the taxonomy term “Prometheus”
Updated Snyk Webhook Integration with New Relic
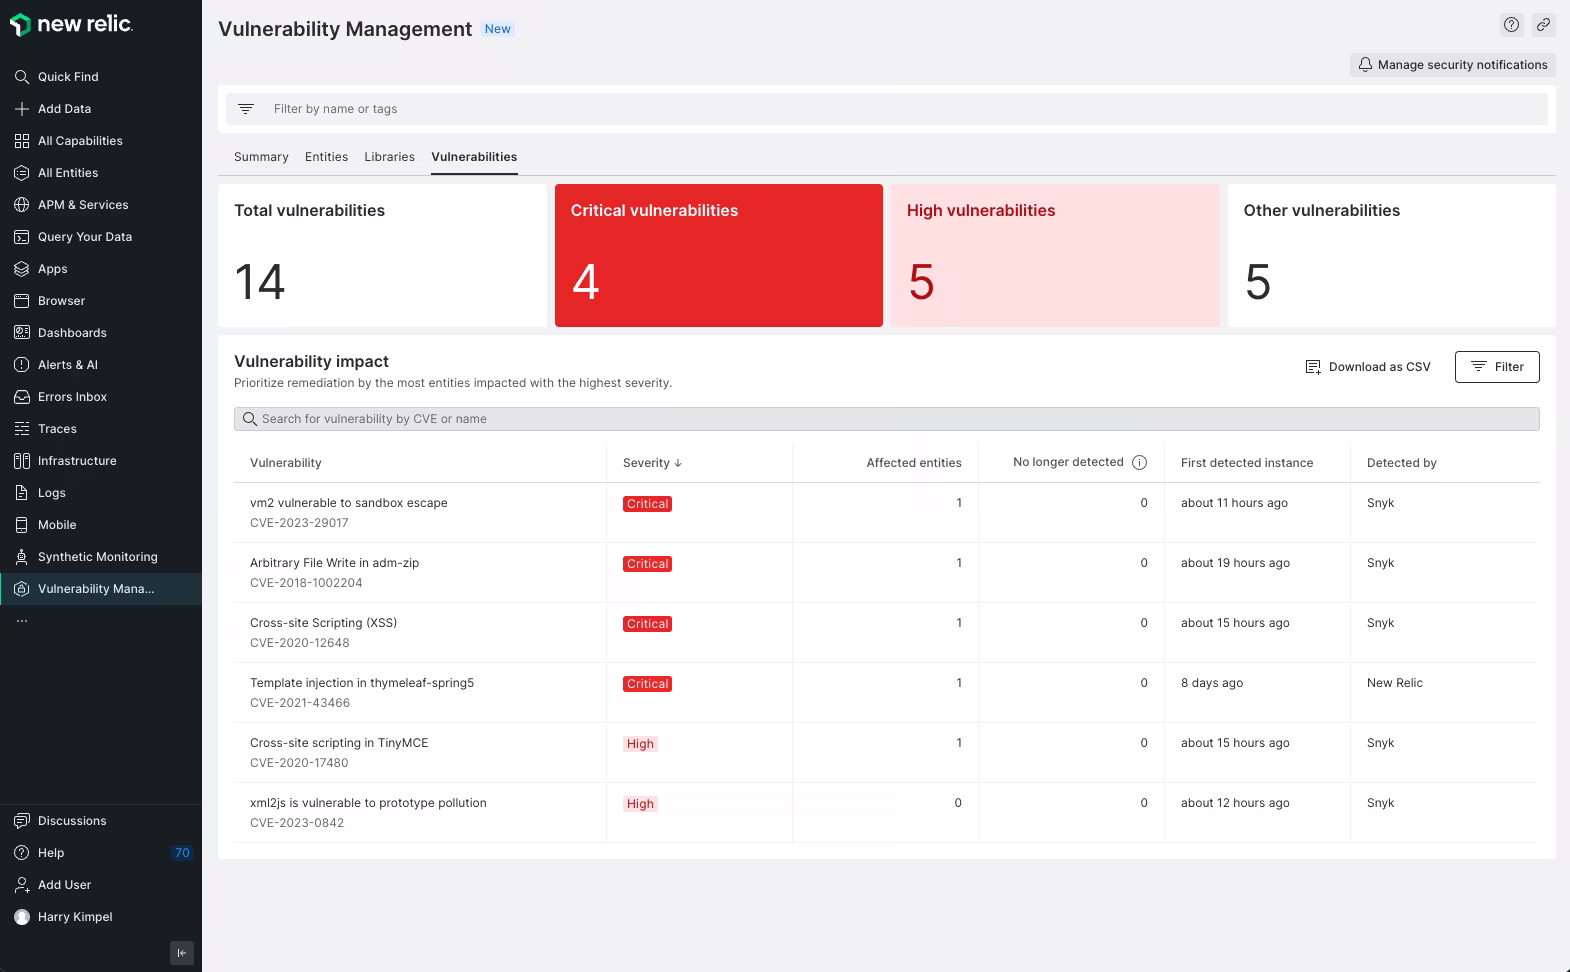
In a recent post I wrote about the ability to send all your application security vulnerabilities found by Snyk directly to your New Relic observability platform.
Now, New Relic made it even easier to achieve that by providing a dedicated security ingest processor that ‘understands’ the payload from a Snyk webhook. All the details on how to get started, create and configure a Snyk webhook to send into your New Relic account is provided in this docs page: https://docs.newrelic.com/docs/vulnerability-management/integrations/snyk/
How to send Snyk vulnerability data to the New Relic observability platform
Security and observability data go hand in hand when it comes to application health. If you can put those two sources of data behind a single pane of glass you can make your life a lot easier. By leveraging the different options that the Snyk platform provides, you can send all your application security vulnerabilities found by Snyk directly to your New Relic observability platform. Let’s see how!
Prerequisites
Here are all the necessary links to get started:
Forward Snyk Vulnerability data to Splunk Observability Cloud
TL;DR
Leverage a Prometheus Exporter to send all your application security vulnerabilities from Snyk into Splunk.
Here are all the necessary links to get started:
- Snyk Exporter: https://github.com/lunarway/snyk_exporter
- Splunk OpenTelemetry Collector for Kubernetes: https://docs.splunk.com/Observability/gdi/opentelemetry/install-k8s.html#otel-install-k8s
Update (2022-09-22)
The option that I am describing here is just one way to achieve this. There might even be a more straight forward option available that I started to describe in a more recent post. Please find an additional approach in my post Snyk Integration Capabilities with WebHooks - some examples.
How to send Snyk Vulnerability data to New Relic using Prometheus?
TL;DR
By leveraging a Prometheus Exporter you can send all your application security vulnerabilities from Snyk into New Relic.
Here are all the necessary links to get started:
- Snyk Exporter: https://github.com/lunarway/snyk_exporter
- New Relic Kubernetes integration: https://docs.newrelic.com/docs/infrastructure/prometheus-integrations/get-started/send-prometheus-metric-data-new-relic/
- New Relic Instant Observability Quickstart: https://newrelic.com/instant-observability/?search=snyk
Update (2022-09-22)
The option that I am describing here is just one way to achieve this. There might even be a more straight forward option available that I started to describe in a more recent post. Please find an additional approach in my post Snyk Integration Capabilities with WebHooks - some examples.
How-To: Set-up New Relic to observe Dapr and it's applications
How-To: Set-up New Relic to collect and observe metrics, traces and logs from Dapr and the underlying applications.
Enable Dapr metrics and logs with New Relic Kubernetes integration for Azure Kubernetes Service (AKS) and application traces using OpenTelemetry.
Prerequisites
- Azure Kubernetes Service
- kubectl
- An installation of Dapr on Kubernetes
- Perpetually free New Relic account, 100 GB/month of free data ingest, 1 free full access user, unlimited free basic users
Enable New Relic Kubernetes integration
The Kubernetes integration monitors worker nodes. In Azure Kubernetes Service, master nodes are managed by Azure and abstracted from the Kubernetes platforms.