Hi, I’m Harry Kimpel 👋
Passionate. Software Craftsman. Family Guy.
I write and talk about observability, .NET, AI/LLMs, OpenTelemetry, and developer experience.

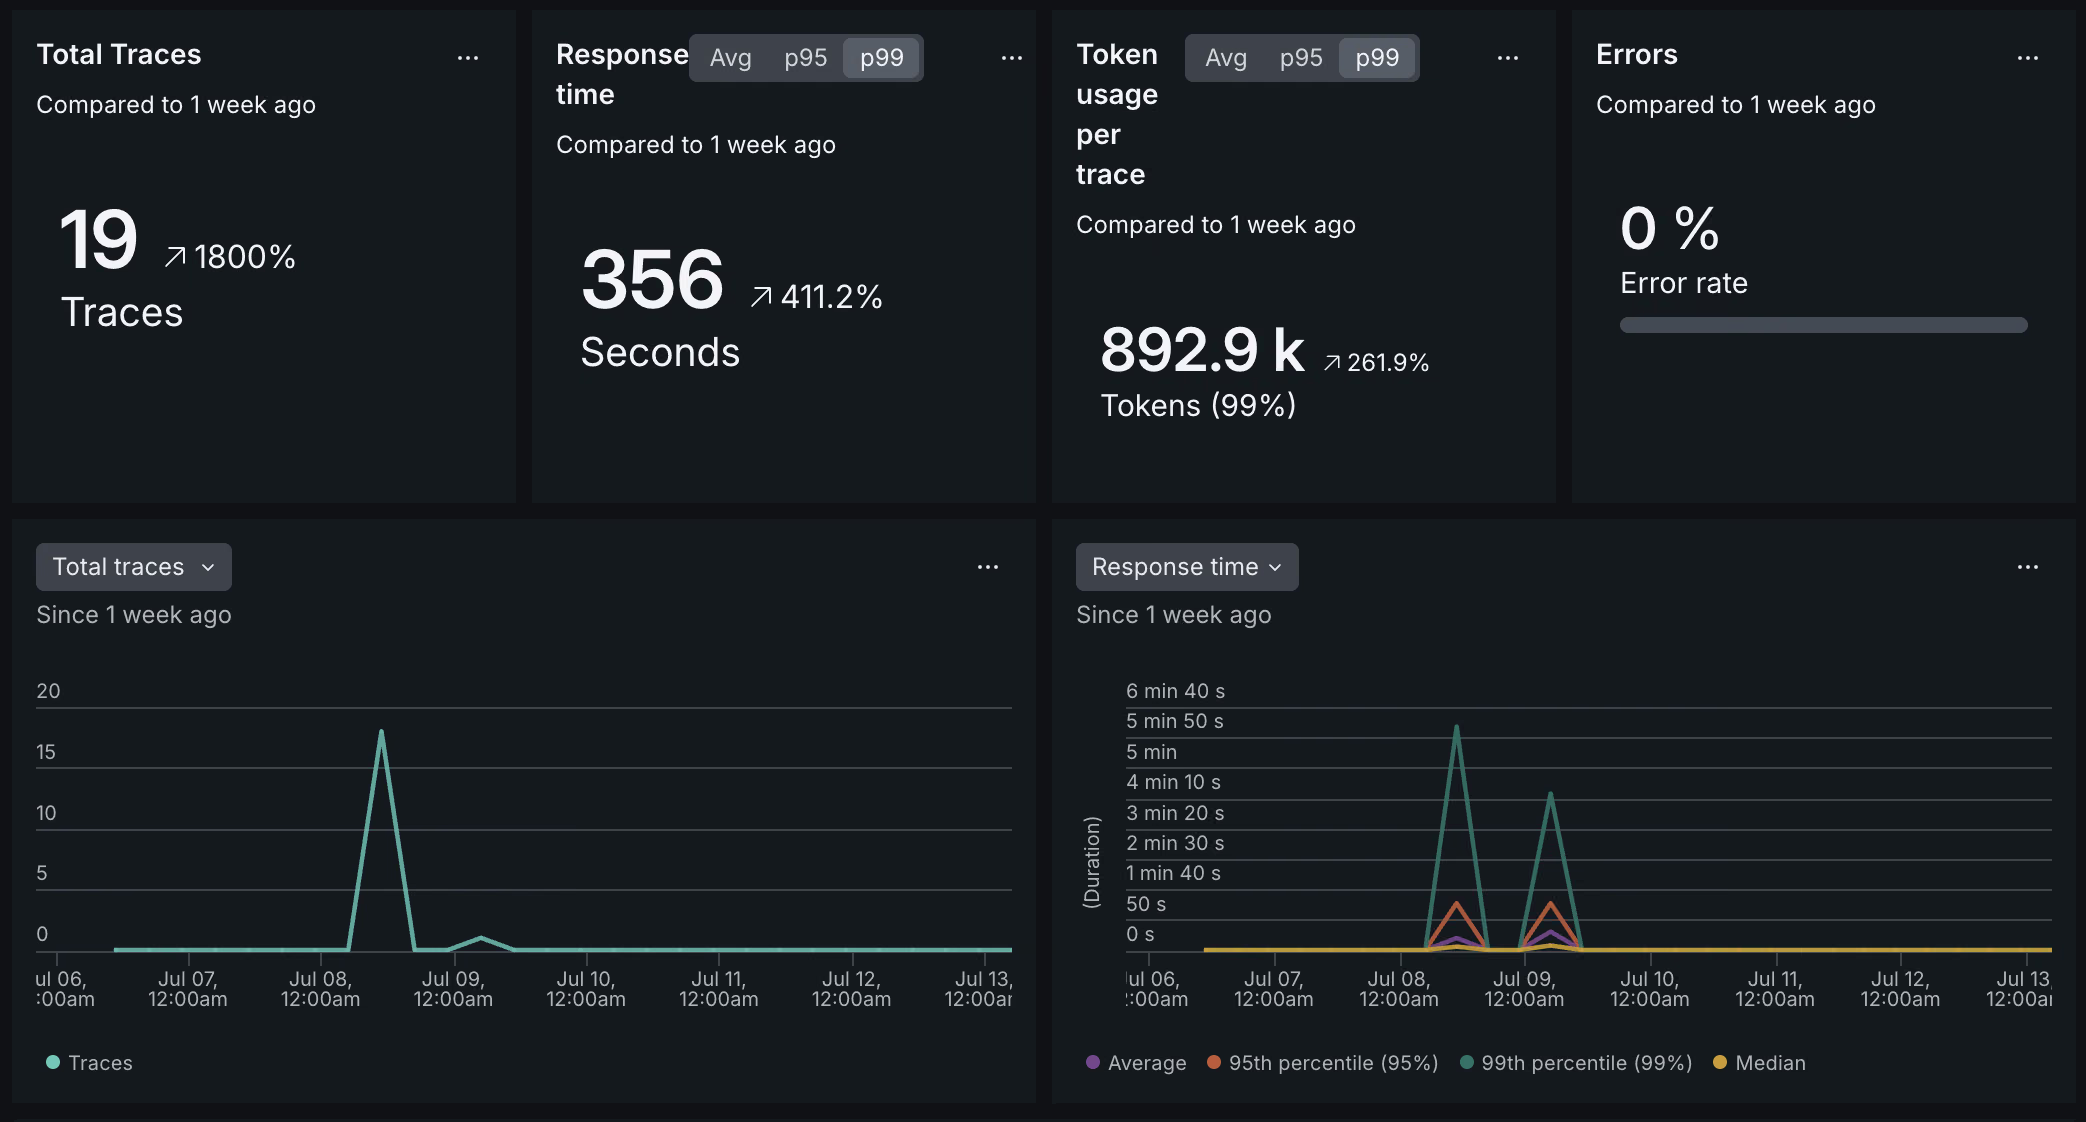
Over the past year I’ve been running a hands-on workshop called “New Relic AI Monitoring Mastery” at developer events. The premise is simple: attendees build a small AI chatbot from scratch using Python, Flask, and the OpenAI API, then instrument it with New Relic to see exactly what’s happening inside. This post captures the key ideas and lessons from those sessions - what metrics matter, how to get visibility quickly, and why model choice has a bigger operational impact than most people expect. ...
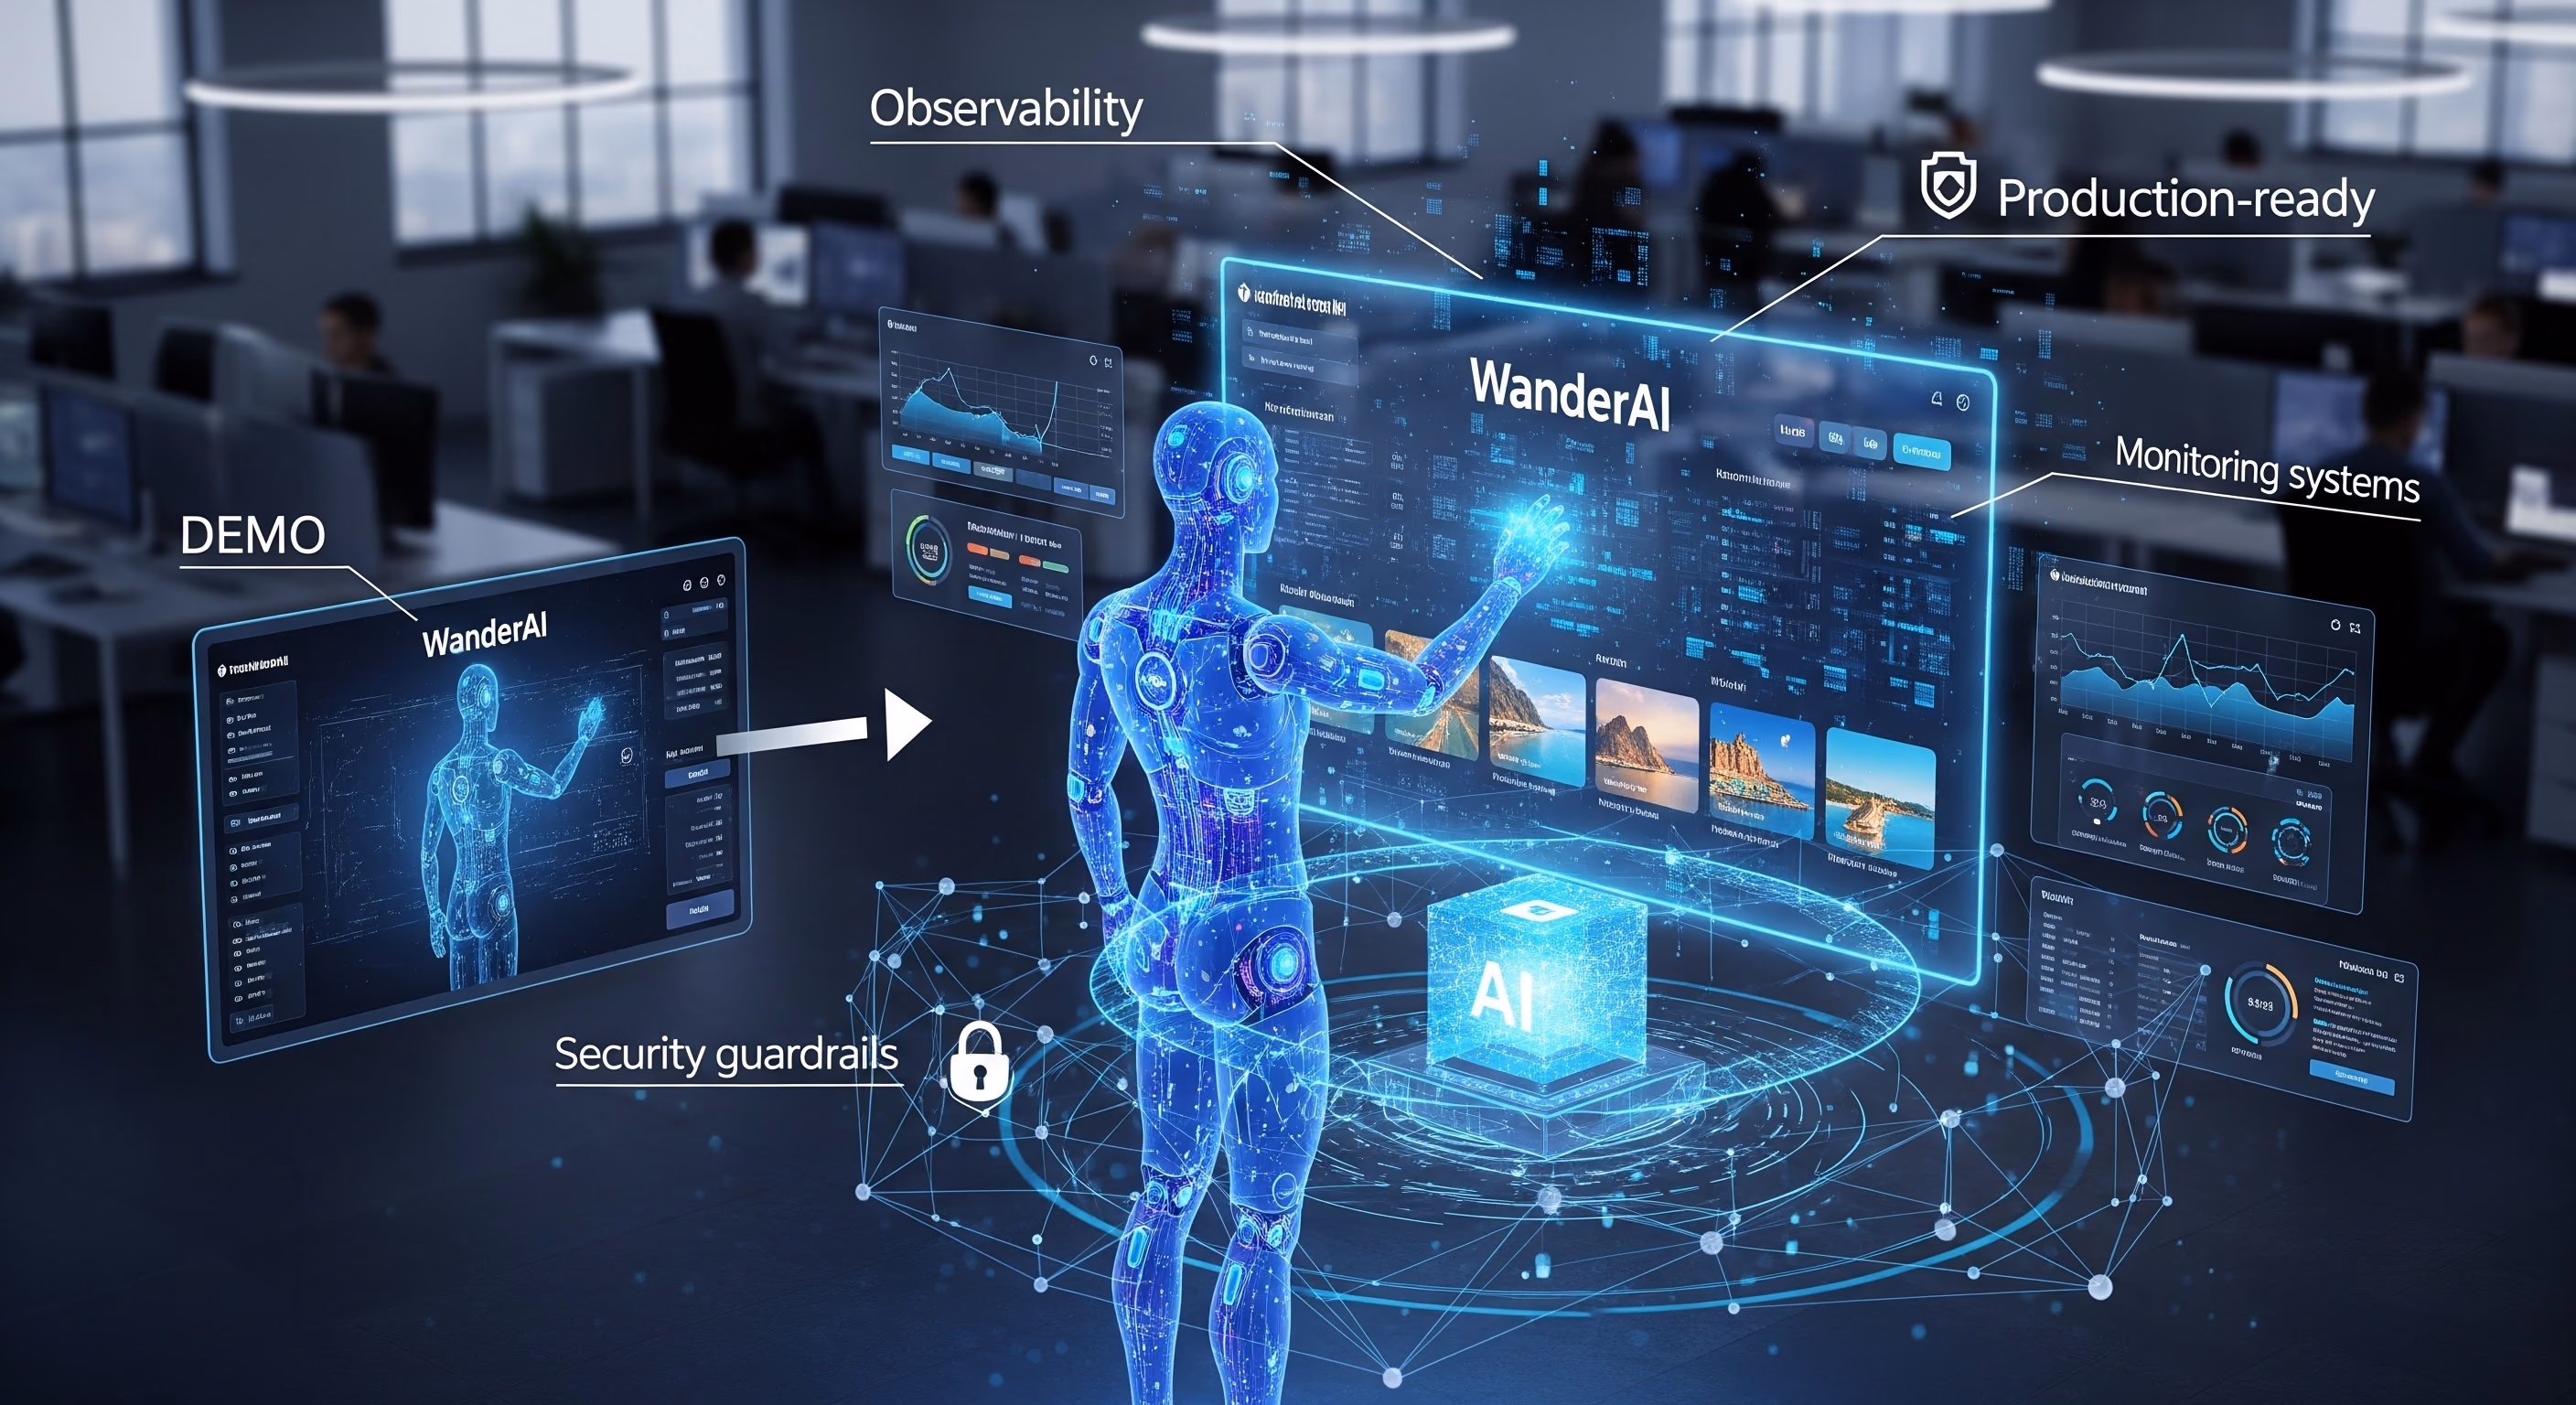
The question that breaks every AI demo Picture the scene. You’ve just founded a travel-planning startup - let’s call it WanderAI. The pitch is simple and gorgeous: a customer types “ten days in Japan, mid-budget, foodie, hates crowds,” and an AI agent crafts a perfect itinerary in seconds. The demo dazzles. Investors lean in. Your co-founder is already drafting the launch tweet. Then someone in the back of the room - operations, maybe, or your cautious head of platform - asks the question that breaks every AI demo: ...
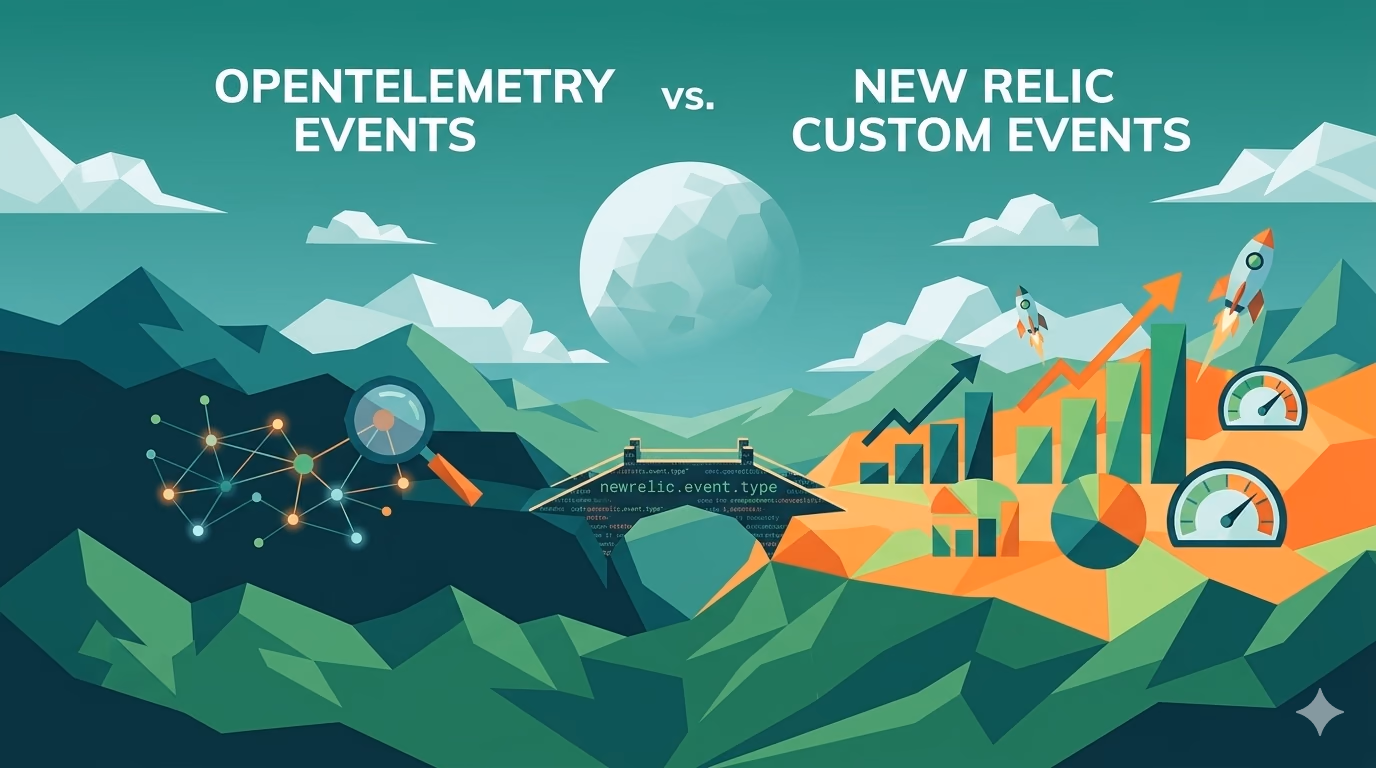
Modern observability isn’t just about logs and traces; it’s about actionable signals. OpenTelemetry (OTel) Events and New Relic Custom Events are both event-driven signals - but they solve different problems. The “why” behind each is about who consumes the data and what decisions it enables. As teams adopt AI-powered services, LLM-based pipelines, and complex distributed architectures, the volume of signals grows exponentially. Knowing which event mechanism to reach for - and when - can mean the difference between a team that reacts to incidents and one that proactively improves its systems. ...
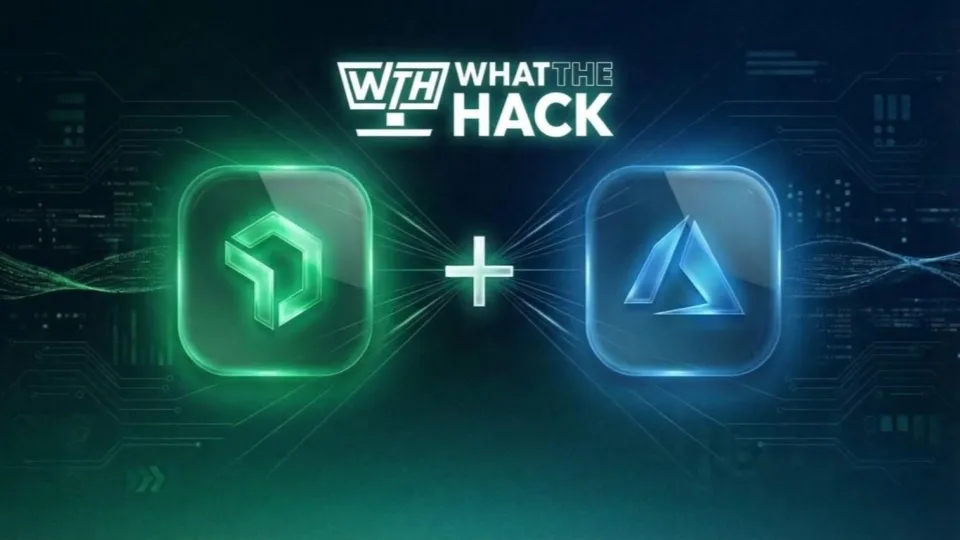
You Founded a Startup. Your AI Agents Are Hallucinating. Your Investors Are Watching Sound fun? It is, actually. On March 27, we’re hosting a free, in-person hackathon at the Microsoft Mountain View Campus (1045 La Avenida St, Mountain View, CA) where you’ll build an AI-powered travel planning assistant from scratch — and then make it production-ready with real observability and security controls. This is part of Microsoft’s What The Hack series: collaborative, challenge-based hackathons where you learn by doing, not by watching someone else’s screen. ...
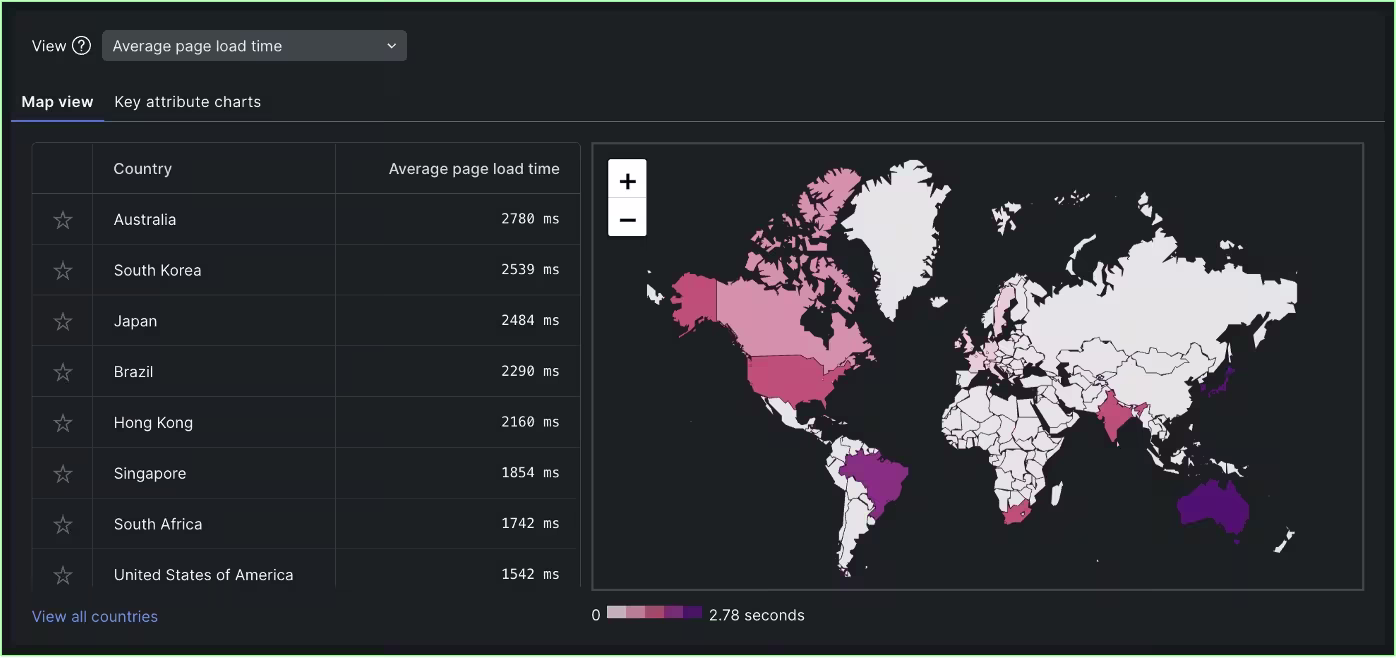
WordPress powers countless websites across various domains, offering incredible versatility. This Content Management System (CMS) is the undisputed leader in the CMS market, powering an impressive 43.6% of all websites globally, according to these statistics. With over 810 million websites built on the platform and hundreds more launching daily (500+), its adoption continues to surge. This widespread use gives WordPress a massive 62% CMS market share, significantly outpacing its rivals. However, even the most robust WordPress sites can face performance challenges. Slowdowns are often caused by factors such as slow-loading plugins, database connection issues, infrastructure capacity problems, network trouble, large page assets (like images or fonts), and broken links. This is why robust monitoring is essential for maintaining a fast, reliable, and user-friendly website. ...

Ideally, you should be using distributed tracing to trace requests through your system, but Kafka decouples producers and consumers, which means there are no direct transactions to trace between them. Kafka also uses asynchronous processes, which have implicit, not explicit, dependencies. That makes it challenging to understand how your microservices are working together. However, it is possible to monitor your Kafka clusters with distributed tracing and OpenTelemetry. You can then analyze and visualize your traces in an open-source distributed tracing tool like Jaeger or a full observability platform like New Relic. In this post, I will leverage a simple application to show how you can achieve this. ...
Greetings fellow .NET enthusiasts and tech aficionados! With the highly-anticipated .NET Conf 2024 just around the corner, I find myself reflecting on how far we’ve come in the world of .NET development and what thrilling innovations are yet to come. A Journey Through .NET Let’s take a quick stroll down memory lane. My experience with .NET technologies dates back to 2002, when I first dipped my toes into the vast sea of possibilities offered by .NET. Over the years, I’ve seen it transform from a promising framework into a powerhouse that underpins countless applications worldwide. Every upgrade has brought something new and exciting, fueling my passion for staying on the cutting edge of technology. ...

AI applications are complex and distributed, making effective monitoring challenging. Combining the New Relic intelligent observability platform with Pulumi’s infrastructure-as-code and secret management solutions allows for an end-to-end “observability as code” approach. This method enables teams to: Define artificial intelligence (AI) and large language model (LLM) monitoring instrumentation along with cloud resources programmatically. Securely manage API keys and cloud account credentials. Automatically deploy New Relic instrumentation alongside AI applications and infrastructure. Benefits include: ...

Effortless integration and enhanced visibility with OpenTelemetry in Blazor WebAssembly Challenges in observing WebAssembly applications Observing WebAssembly applications presents unique challenges that stem from its design and execution environment. Unlike traditional web applications, where monitoring tools can hook directly into JavaScript and the Document Object Model (DOM), WebAssembly runs as binary code executed within the browser’s sandbox. This layer of abstraction complicates direct introspection, as traditional monitoring tools are not designed to interact with the lower-level operations of WebAssembly. The Bytecode Alliance plays a crucial role here, promoting standards and tools that aim to enhance the security and usability of WebAssembly, including better support for observability. Moreover, the performance characteristics of WebAssembly, which can closely approach native speeds, demand monitoring solutions that are both highly efficient and minimally invasive to avoid impacting the user experience. This creates a complex scenario for developers who need detailed visibility into their applications’ behavior without sacrificing performance. ...

Streamlining Container Log Management for Clarity and Control Hello, New Relic aficionados! Picture this: you’re at a bustling local user group meetup, exchanging ideas and sharing tech stories. Amidst the animated discussions and clinking coffee cups, a fellow developer—let’s call him Alex—shares a frustrating puzzle. Alex’s Docker Compose applications are acting like rebellious teenagers, sending their logs to the New Relic Host UI instead of their designated New Relic Container UI. As you dive deeper into the problem, a light bulb goes off. This isn’t just Alex’s struggle; it’s a common snag affecting many of us in the Docker and New Relic community. ...