How to send Snyk Vulnerability data to New Relic using Prometheus?
- 5 minutes read - 1046 wordsTL;DR
By leveraging a Prometheus Exporter you can send all your application security vulnerabilities from Snyk into New Relic.
Here are all the necessary links to get started:
- Snyk Exporter: https://github.com/lunarway/snyk_exporter
- New Relic Kubernetes integration: https://docs.newrelic.com/docs/infrastructure/prometheus-integrations/get-started/send-prometheus-metric-data-new-relic/
- New Relic Instant Observability Quickstart: https://newrelic.com/instant-observability/?search=snyk
Update (2022-09-22)
The option that I am describing here is just one way to achieve this. There might even be a more straight forward option available that I started to describe in a more recent post. Please find an additional approach in my post Snyk Integration Capabilities with WebHooks - some examples.
And please get in touch to let me know what you think. Any feedback is more than welcome.
Preface
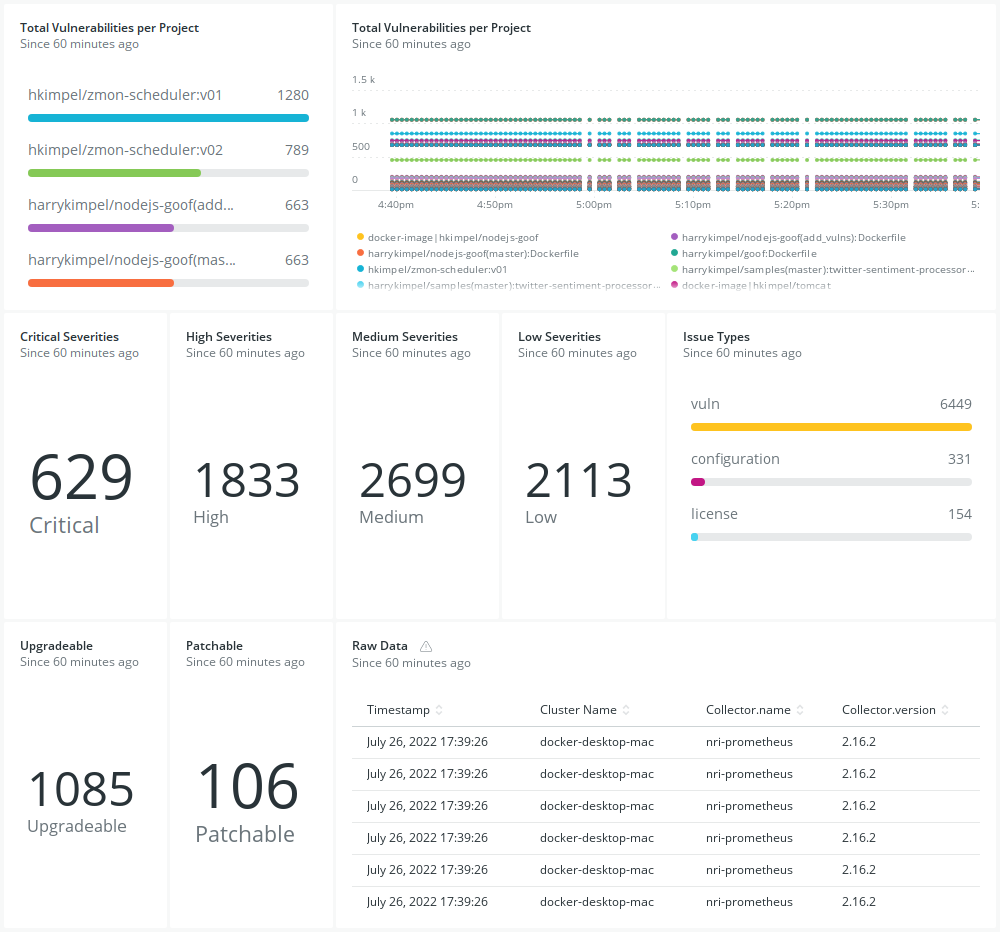
Everything that I am describing in this article can be deployed and tested with a free Snyk account, the open source Snyk exporter (not a Snyk owned integration) and a free New Relic account. The only caveat is that the New Relic quickstart might not yet be available in order to automatically create a dashboard to visualize the metrics. However, I also added a dashboard JSON representation of a sample dashboard that you can import into New Relic and use as a starting point.
The Basics
Snyk (stands for So Now You Know) is a developer first application security testing solution that covers all aspects of a modern application. Snyk capabilities includes static application security testing (SAST), software composition analysis (SCA), container scanning and Infrastructure-as-Code (IaC) scanning. The value propositions of Snyk are based on these guiding principles:
- the platform approach: that helps consolidate and correlate all of its technical capabilities (SAST to SCA, IaC to container, etc.)
- shift left approach: to support, enable and also educate developers on security topics
- finding, fixing, preventing and monitoring of security vulnerabilities: Snyks focus always has been to not only help find issues in applications, but also help fix those including, but not limiting to automated fix pull requests (fix PRs) in various source code management systems
Snyks key advantage is the flexibility when it comes to using the different scanning capabilities. In order to truly count as a developer tool, you need to live where developers spend their time, i.e. in the IDE. Snyk supports all major development environments including Visual Studio Code, Visual Studio, Eclipse, IntelliJ and many more. However, there are also various other forms of integrations, such as:
-
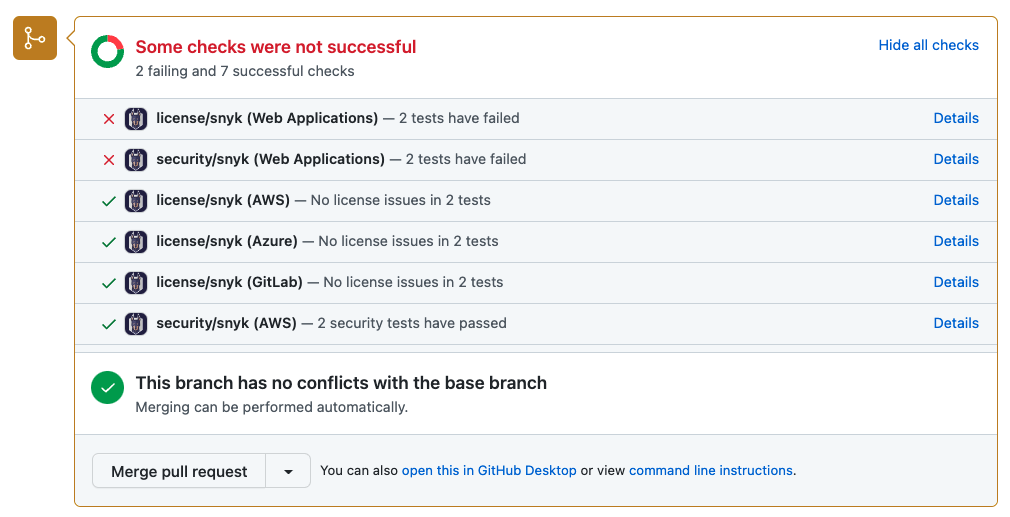
Git integrations to have automatic tasks run on pull requests
-
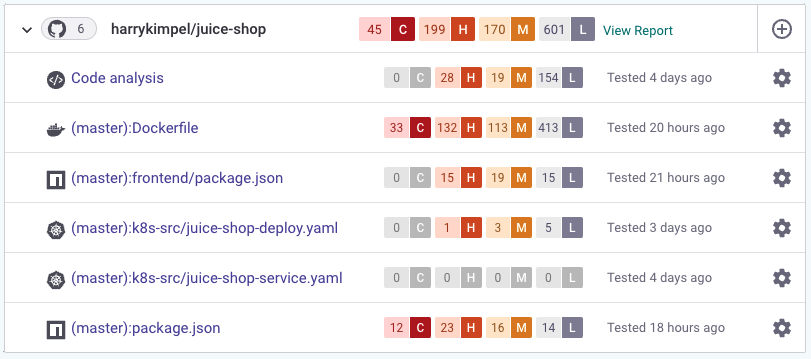
Scan from Git repositories
-
Incorporate into CI/CD tools via native plugins or by leveraging the CLI
name: Example workflow using Snyk
on: push
jobs:
  security:
    runs-on: ubuntu-latest
    steps:
      - uses: actions/checkout@master
      - name: Run Snyk to check for vulnerabilities
        uses: snyk/actions/node@master
        env:
          SNYK_TOKEN: ${{ secrets.SNYK_TOKEN }}
        with:
          command: monitor
- Monitor your production workloads through serverless or Kubernetes (K8s) integrations or by continuously scanning your container registry
What Happens to Scan Results?
Ideally, the scan results can be used whereever and whenever it is most appropriate for the given use case. CLI and IDE integrations can of course show scan results directly in the terminal or directly within the IDE (red squiggly or wavy lines in your code editor).
Snyk does not stop there! You can also visualize the data in the portal/UI from repository scans or from scans inside of your favorite CI/CD environment.
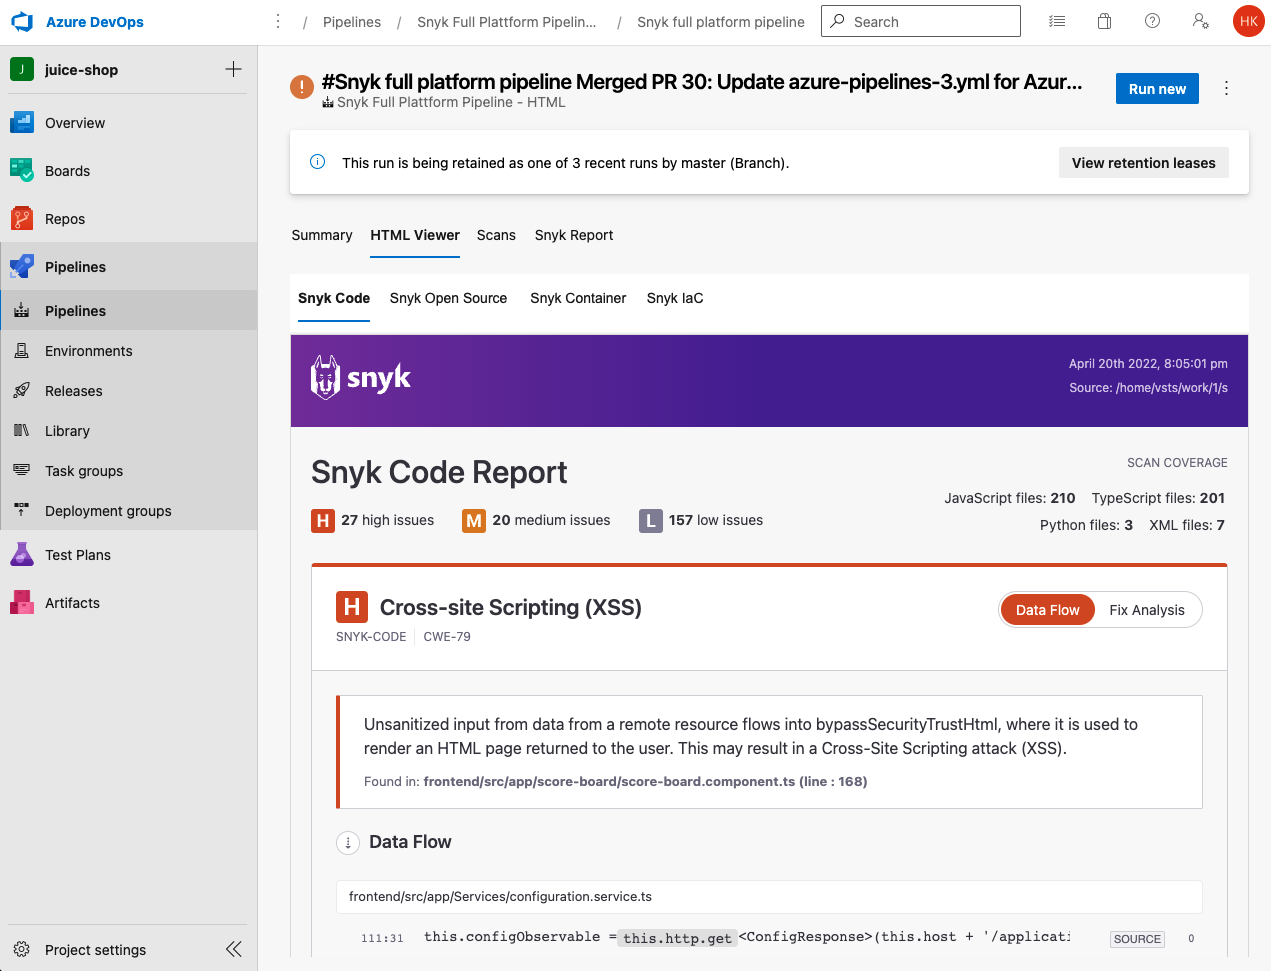
What’s also very nice is the fact that you could also leverage native solutions for the various CI/CD tools. For example, you can even send scan results into GitHub or GitLab Security Center, show results in Azure DevOps reports or various other forms of integrations.
The Use Case for an Observability tool such as New Relic
New Relic is a great tool in the observability space that allows you to integrate and correlate all different kinds of monitoring data such as Metrics, Events, Logs and Traces (MELT) into a single platform with native capabilities for a broad set of environments.
Customers know exactly what is going on with their applications through APM or by monitoring their Kubernetes clusters to know what Pods run including the health of all its containers. In such a use case, you ideally would also want to understand whether or not some of these deployments have any security issues or contain potential security vulnerabilities.
This is the type of use case that is covered in this article.
How to get started?
Snyk Exporter is an open source tool that allows for exporting scanning data into Prometheus metrics by scraping the Snyk HTTP API. This Prometheus exporter can easily be deployed into a Kubernetes cluster. This is the scenario described in this article. The exporter could also run outside of Kubernetes in a standalone fashion.
The use case in this article focuses on Kubernetes. The primary reason is that I want to leverage New Relic’s Prometheus OpenMetrics integrations for Docker and Kubernetes to scrape Prometheus endpoints and send the data to New Relic, so you can store and visualize crucial metrics on one platform.
Follow these deployment steps:
1. Deploy Snyk exporter
Snyk exporter already contains deployment YAMLs that you can adjust (secrets.yaml contains the API token for your Snyk account) and deploy using:
kubectl apply -f examples/secrets.yaml
kubectl apply -f examples/deployment.yaml
2. Deploy New Relic Kubernetes integration
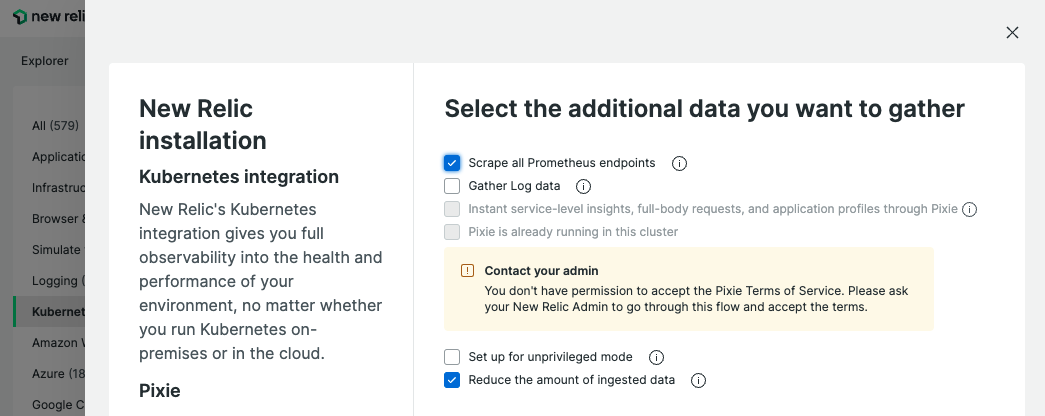
You can use New Relic’s guided install from the UI to configure a custom install and deploy script for the Kubernetes integration. Just make sure to check the option to Scrape all Prometheus endpoints.
3. Leverage the New Relic Quickstarts
As soon as you deploy the New Relic Kubernetes integration, you should see metrics from the Snyk Exporter flowing in.
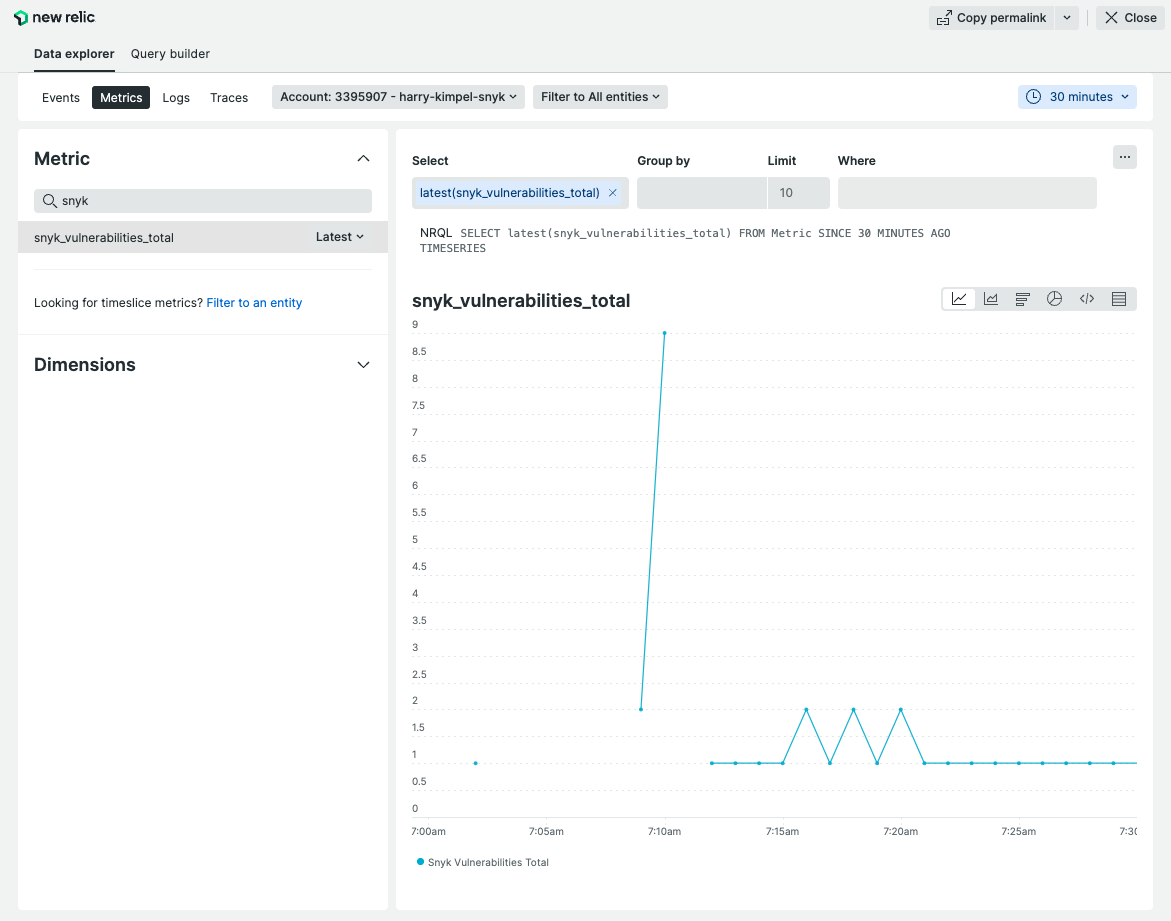
You don’t need to create your own dashboard to visualize these metrics, but can leverage the existing dashboard from the quickstart to create in your New Relic account. Alert policies and definitions will hopefully also be added to the quickstart soon.
4. Check out the dashboard
Once the quickstart is ready, you can go to your dashboards section within New Relic and look at the Snyk dashboard that has been created for you, visualizing all the metrics from the Snyk exporter.

Related Links/References
- Snyk Exporter: https://github.com/lunarway/snyk_exporter
- New Relic Kubernetes integration: https://docs.newrelic.com/docs/infrastructure/prometheus-integrations/get-started/send-prometheus-metric-data-new-relic/
- New Relic Instant Observability Quickstart: https://newrelic.com/instant-observability/?search=snyk
- GitHub repo for New Relic Instant Observability Quickstarts: https://github.com/newrelic/newrelic-quickstarts
- New Relic Sample Dashboard (JSON): https://www.kimpel.com/post/snyk/snyk-to-newrelic-using-prometheus-exporter/newrelic_dashboard.json
- JSON representation for the Snyk dashboard: https://github.com/newrelic/newrelic-quickstarts/tree/main/dashboards/snyk