How-To: Set-up New Relic to observe Dapr and it's applications
- 8 minutes read - 1531 wordsHow-To: Set-up New Relic to collect and observe metrics, traces and logs from Dapr and the underlying applications.
Enable Dapr metrics and logs with New Relic Kubernetes integration for Azure Kubernetes Service (AKS) and application traces using OpenTelemetry.
Prerequisites
- Azure Kubernetes Service
- kubectl
- An installation of Dapr on Kubernetes
- Perpetually free New Relic account, 100 GB/month of free data ingest, 1 free full access user, unlimited free basic users
Enable New Relic Kubernetes integration
The Kubernetes integration monitors worker nodes. In Azure Kubernetes Service, master nodes are managed by Azure and abstracted from the Kubernetes platforms.
The easiest way to install the Kubernetes integration is to use our automated installer to generate a manifest. It bundles not just the integration DaemonSets, but also other New Relic Kubernetes configurations, like Kubernetes events, Prometheus OpenMetrics, and New Relic log monitoring.
Automated installer
- Select the New Relic account you want to send events, metrics and logs to.
- Provide a name of your AKS cluster
- Provide the namespace for Kubernetes integration
- Select the details of the integration
- Download the Kubernetes manifest file
- Note: If you plan to automate the setup process - with Helm chart, for instance - continue in with docs

Deploy integration
To deploy, run this command in your console, and insert the path to where you downloaded the manifest.
~$ kubectl apply -f newrelic-manifest.yaml -n dapr-monitoring
Validation
Ensure New Relic Kubernetes integration is running
~$ kubectl get pods -n dapr-monitoring

NAME                                            READY   STATUS    RESTARTS    AGE
nri-bundle-kube-state-metrics-f7cf766ff-2bdt6   1/1     Running   0           16m
nri-bundle-newrelic-infrastructure-48wdk        1/1     Running   0           16m
nri-bundle-newrelic-infrastructure-fj4pz        1/1     Running   0           16m
nri-bundle-newrelic-logging-7gw8k               1/1     Running   0           16m
nri-bundle-newrelic-logging-b6fwx               1/1     Running   0           16m
nri-bundle-nri-kube-events-6899758c57-rfmvq     2/2     Running   0           16m
nri-bundle-nri-prometheus-689d7b6f45-gfrgx      1/1     Running   0           16m
Ensure Dapr is running
~$ kubectl get pods -n dapr-system

NAME                                  READY   STATUS    RESTARTS    AGE
dapr-operator-59ddb59f4c-4fgzm        1/1     Running   0           16m
dapr-placement-599d87d5cb-n6zpc       1/1     Running   0           16m
dapr-sentry-777658c665-z4qhb          1/1     Running   0           16m
dapr-sidecar-injector-56c4588-4rs8z   1/1     Running   0           16m
New Relic Kubernetes Cluster Explorer
The New Relic Kubernetes Cluster Explorer provides a unique visualization of the entire data and deployments of the data collected by the Kubernetes integration.

Install Quickstart application Distributed calculator
Basics
This quickstart shows method invocation and state persistent capabilities of Dapr through a distributed calculator where each operation is powered by a different service written in a different language/framework:
- Addition: Go mux application
- Multiplication: Python flask application
- Division: Node Express application
- Subtraction: .NET Core application
The front-end application consists of a server and a client written in React.
The below illustration shows the underlying architecture:

State Store
For state store I am using Redis and deploy it using the following command:
~$ helm install redis bitnami/redis
~$ export REDIS_PASSWORD=$(kubectl get secret --namespace default \redis -o jsonpath="{.data.redis-password}" | base64 --decode

NAME              READY   STATUS    RESTARTS    AGE
redis-master-0    1/1     Running   0           16m
redis-slave-0     1/1     Running   0           16m
redis-slave-1     1/1     Running   0           16m
For further details, follow these instructions to create and configure a Redis store
Configure Zipkin Exporter
Dapr natively captures metrics and traces that can be send directly to New Relic. The easiest way to export these is by providing a Zipkin exporter configured to send the traces to New Relic’s Trace API.
In order for the integration to send data to New Relic Telemetry Data Platform, you need a New Relic Insights Insert API key.
apiVersion: dapr.io/v1alpha1
kind: Component
metadata:
  name: zipkin
  namespace: default
spec:
  type: exporters.zipkin
  metadata:
    - name: enabled
      value: "true"
    - name: exporterAddress
      value: "https://trace-api.newrelic.com/trace/v1?Api-Key=<NR-INSIGHTS-INSERT-API-KEY>&Data-Format=zipkin&Data-Format-Version=2"
Viewing Traces
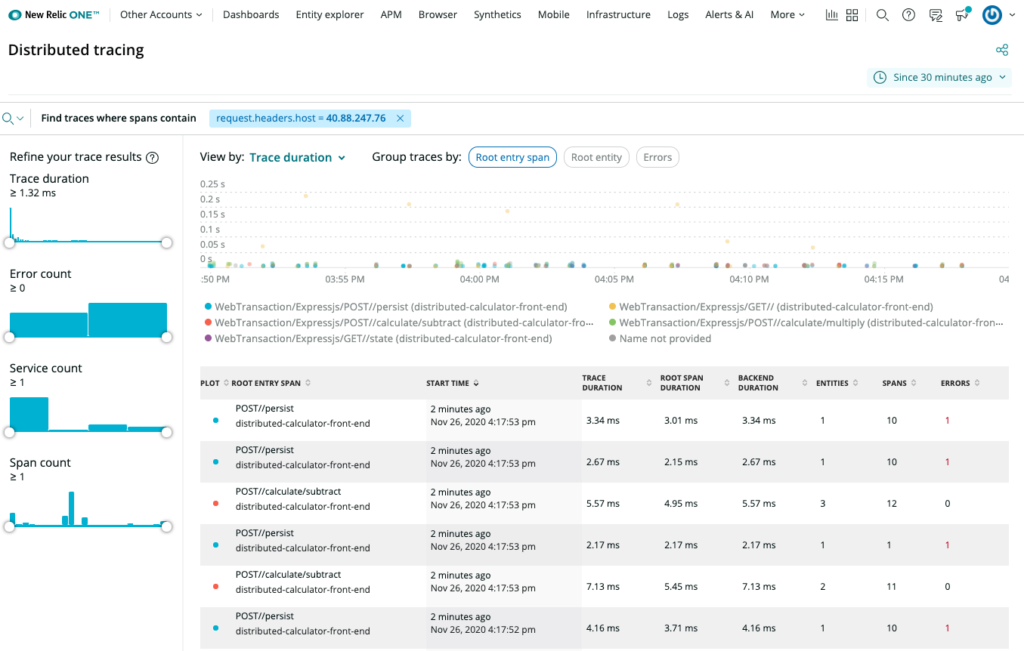
New Relic Distributed Tracing overview

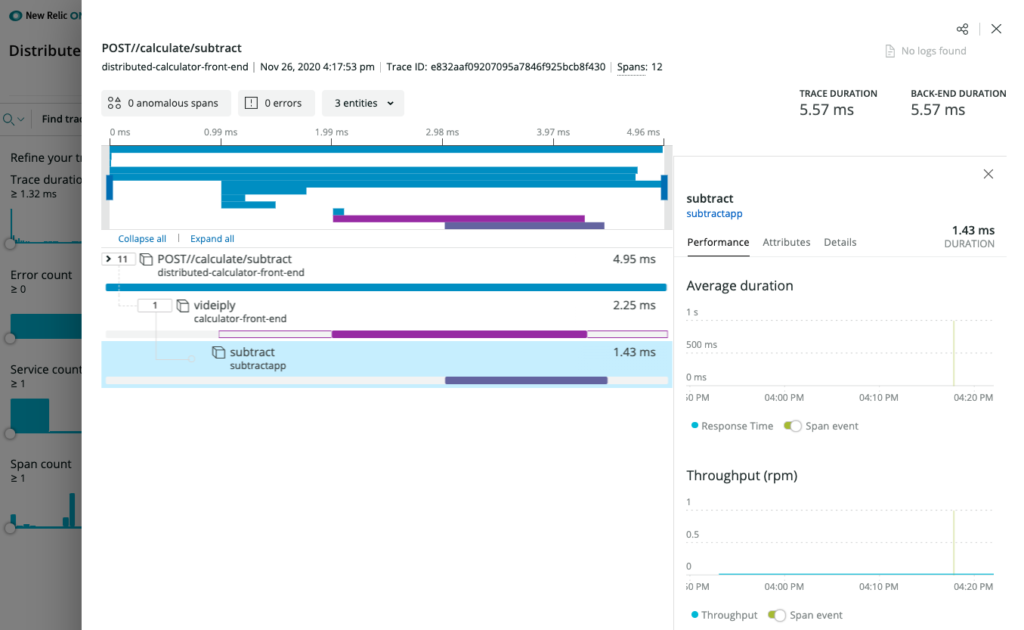
New Relic Distributed Tracing details
New Relic Instrumentation
I have forked the above mentioned repo for the Distributed Calculator and updated the configuration to use New Relic code instrumentation and OpenTelemetry exporters using specific language agents or SDKs.
In order for the integrations to send data to New Relic Telemetry Data Platform, you either need a New Relic license key or New Relic Insights Insert API key. Both of these can easily be gathered/created from within the account you created in prerequisites.
New Relic Language agent
As an example, the New Relic agent instrumentation for .NET Core is part of the Dockerfile:
FROM mcr.microsoft.com/dotnet/core/sdk:3.1 AS build-env
WORKDIR /app

# Copy csproj and restore as distinct layers
COPY *.csproj ./
RUN dotnet restore

# Copy everything else and build
COPY . ./
RUN dotnet publish -c Release -o out

# Build runtime image
FROM mcr.microsoft.com/dotnet/core/aspnet:3.1

# Install the agent
RUN apt-get update && apt-get install -y wget ca-certificates gnupg \
    && echo 'deb https://apt.newrelic.com/debian/ newrelic non-free' | tee /etc/apt/sources.list.d/newrelic.list \
    && wget https://download.newrelic.com/548C16BF.gpg \
    && apt-key add 548C16BF.gpg \
    && apt-get update \
    && apt-get install -y newrelic-netcore20-agent

# Enable the agent
ENV CORECLR_ENABLE_PROFILING=1 \
    CORECLR_PROFILER={36032161-FFC0-4B61-B559-F6C5D41BAE5A} \
    CORECLR_NEWRELIC_HOME=/usr/local/newrelic-netcore20-agent \
    CORECLR_PROFILER_PATH=/usr/local/newrelic-netcore20-agent/libNewRelicProfiler.so \
    NEW_RELIC_LICENSE_KEY=<NEW-RELIC-LICENSE-KEY> \
    NEW_RELIC_APP_NAME=distributed-calculator-dotnet-subtractor \
    NEW_RELIC_DISTRIBUTED_TRACING_ENABLED=true

WORKDIR /app
COPY --from=build-env /app/out .
ENTRYPOINT ["dotnet", "Subtract.dll"]
OpenTelemetry instrumentation
Similarly to the New Relic agent instrumentation, I have also leveraged New Relic Telemetry SDK and OpenTelemetry support for .NET. In this case, I am using the OpenTelemetry Trace Exporter that is included in the Startup.cs.
I added the package using this command:
~$ dotnet add package NewRelic.OpenTelemetry
The sample code in Startup.cs looks like this (see method ConfigureServices):
// ------------------------------------------------------------
// Copyright (c) Microsoft Corporation.
// Licensed under the MIT License.
// ------------------------------------------------------------

using Microsoft.AspNetCore.Builder;
using Microsoft.AspNetCore.Hosting;
using Microsoft.Extensions.Configuration;
using Microsoft.Extensions.DependencyInjection;
using Microsoft.Extensions.Hosting;
using OpenTelemetry.Trace;

namespace Subtract
{
    public class Startup
    {
        public Startup(IConfiguration configuration)
        {
            Configuration = configuration;
        }

        public IConfiguration Configuration { get; }

        // This method gets called by the runtime. Use this method to add services to the container.
        public void ConfigureServices(IServiceCollection services)
        {
            services.AddControllers();

            services.AddOpenTelemetryTracing((serviceProvider, tracerBuilder) =>
            {
                // Make the logger factory available to the dependency injection
                // container so that it may be injected into the OpenTelemetry Tracer.
                var loggerFactory = serviceProvider.GetRequiredService<ILoggerFactory>();

                // Adds the New Relic Exporter loading settings from the appsettings.json
                tracerBuilder
                    .AddNewRelicExporter(options =>
                  {
                      options.ApiKey = this.Configuration.GetValue<string>("NewRelic:ApiKey");
                      options.ServiceName = this.Configuration.GetValue<string>("NewRelic:ServiceName");
                  }, loggerFactory)
                    .AddAspNetCoreInstrumentation()
                    .AddHttpClientInstrumentation();
            });
        }

        // This method gets called by the runtime. Use this method to configure the HTTP request pipeline.
        public void Configure(IApplicationBuilder app, IWebHostEnvironment env)
        {
            if (env.IsDevelopment())
            {
                app.UseDeveloperExceptionPage();
            }

            app.UseRouting();
            app.UseEndpoints(endpoints =>
            {
                endpoints.MapControllers();
            });
        }
    }
}
Deploying the Distributed Calculator to Kubernetes
- Navigate to the deploy directory in this quickstart directory: cd deploy
- Deploy all of your resources: kubectl apply -f .
- Each of the services will spin up a pod with two containers: one for your service and one for the Dapr sidecar. It will also configure a service for each sidecar and an external IP for the front-end, which allows us to connect to it externally.
- Wait until your pods are in a running state: kubectl get pods -w
NAME                                    READY   STATUS    RESTARTS    AGE
addapp-db55c4f7d-gl28n                  2/2     Running   0           59s
calculator-front-end-7cd9cd86c7-wptp8   2/2     Running   0           59s
divideapp-9fdc496bc-nn8pb               2/2     Running   0           59s
multiplyapp-76b8bf79b4-hrdf8            2/2     Running   0           59s
redis-master-0                          1/1     Running   0           32m
redis-slave-0                           1/1     Running   0           32m
redis-slave-1                           1/1     Running   0           32m
subtractapp-649fbdd7fd-sgphw            2/2     Running   0           59s
- Next, take a look at the services and wait until you have an external IP configured for the front-end: kubectl get svc -w
NAME                        TYPE          CLUSTER-IP    EXTERNAL-IP     PORT(S)                               AGE
addapp-dapr                 ClusterIP     None          <none>    80/TCP,50001/TCP,50002/TCP,9090/TCP   43s
calculator-front-end        LoadBalancer  10.0.54.72    20.62.219.85    80:30953/TCP                          43s
calculator-front-end-dapr   ClusterIP     None          <none>    80/TCP,50001/TCP,50002/TCP,9090/TCP   43s
divideapp-dapr              ClusterIP     None          <none>    80/TCP,50001/TCP,50002/TCP,9090/TCP   43s
kubernetes                  ClusterIP     10.0.0.1      <none>    443/TCP                               37m
multiplyapp-dapr            ClusterIP     None          <none>    80/TCP,50001/TCP,50002/TCP,9090/TCP   37m
redis-headless              ClusterIP     None          <none>    6379/TCP                              37m
redis-master                ClusterIP     10.0.238.122  <none>    6379/TCP                              43s
redis-slave                 ClusterIP     10.0.115.184  <none>    6379/TCP
subtractapp-dapr            ClusterIP     None          <none>    80/TCP,50001/TCP,50002/TCP,9090/TCP
Each service ending in “-dapr” represents your services respective sidecars, while the calculator-front-end service represents the external load balancer for the React calculator front-end.
- Take the external IP address for calculator-front-end and drop it in your browser and voilà! You have a working distributed calculator!
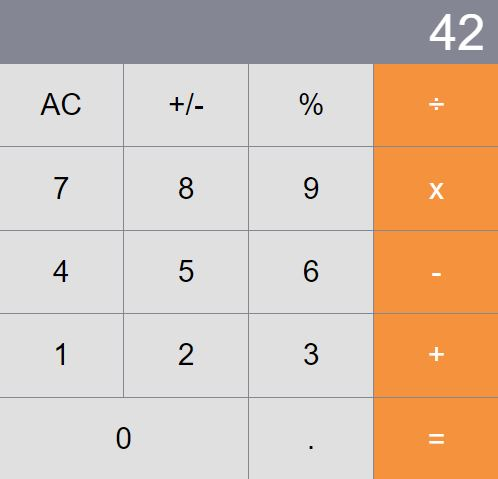
Observing all data collected from Kubernetes, Dapr and the Distributed Calculator
New Relic Kubernetes Cluster Explorer is a good starting point to observe all your data and dig deeper into any performance issues or incidents happening inside of the application or microservices.
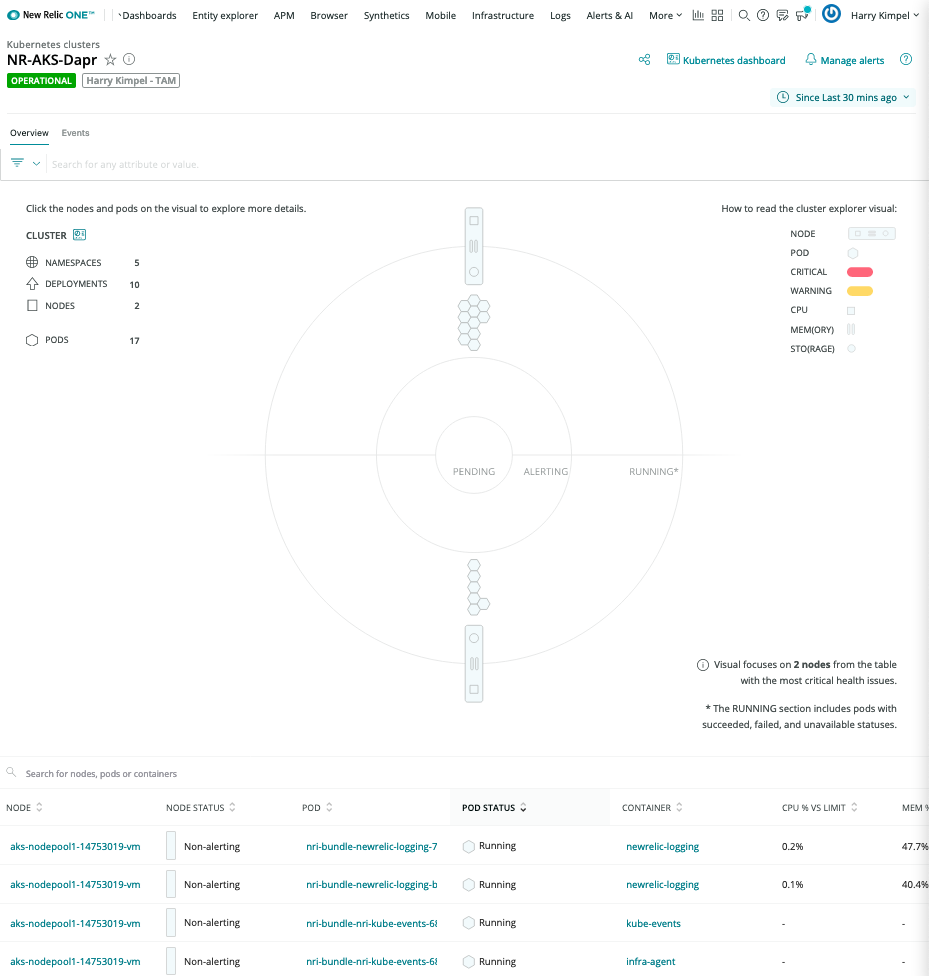
Automated correlation is part of the visualization capabilities of New Relic.
Pod-level details
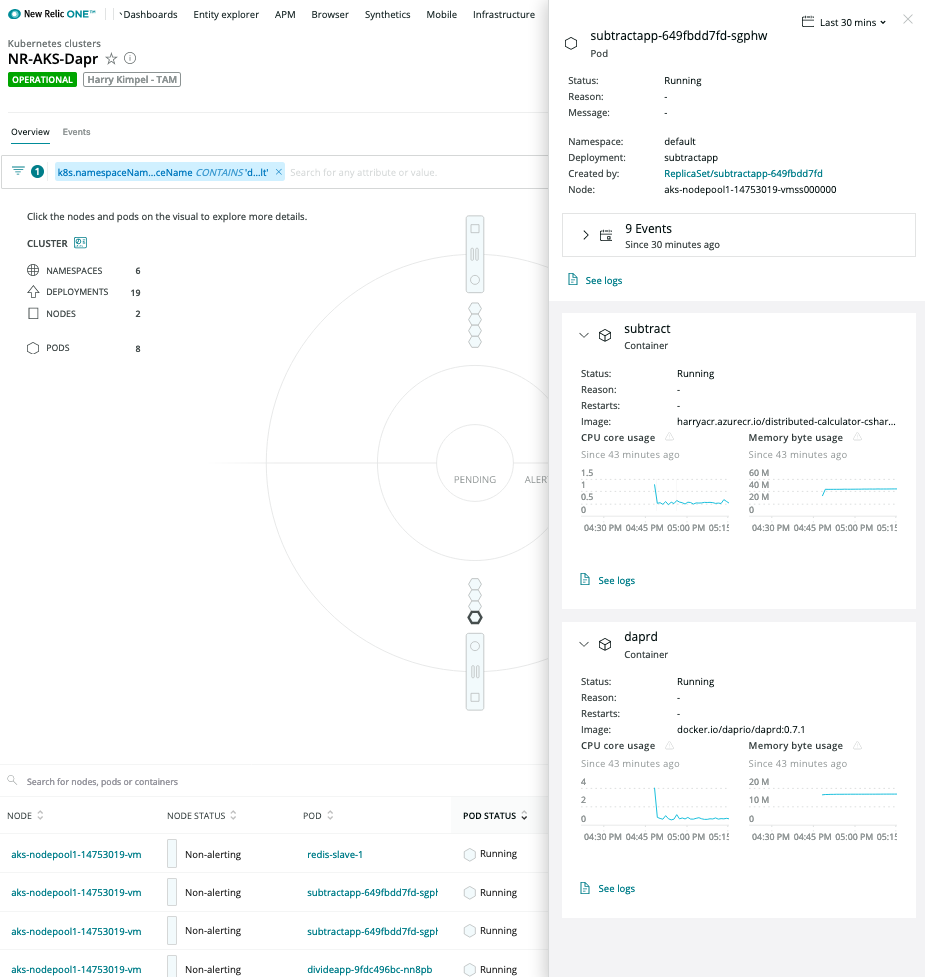
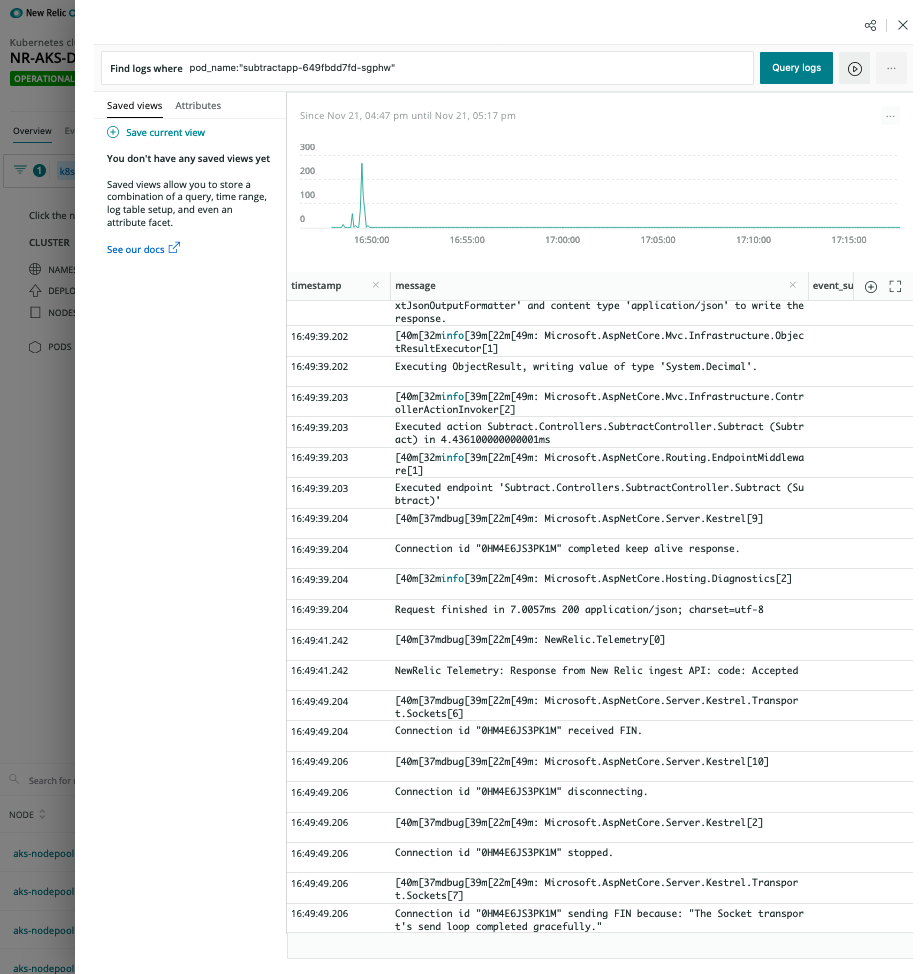
Logs in Context
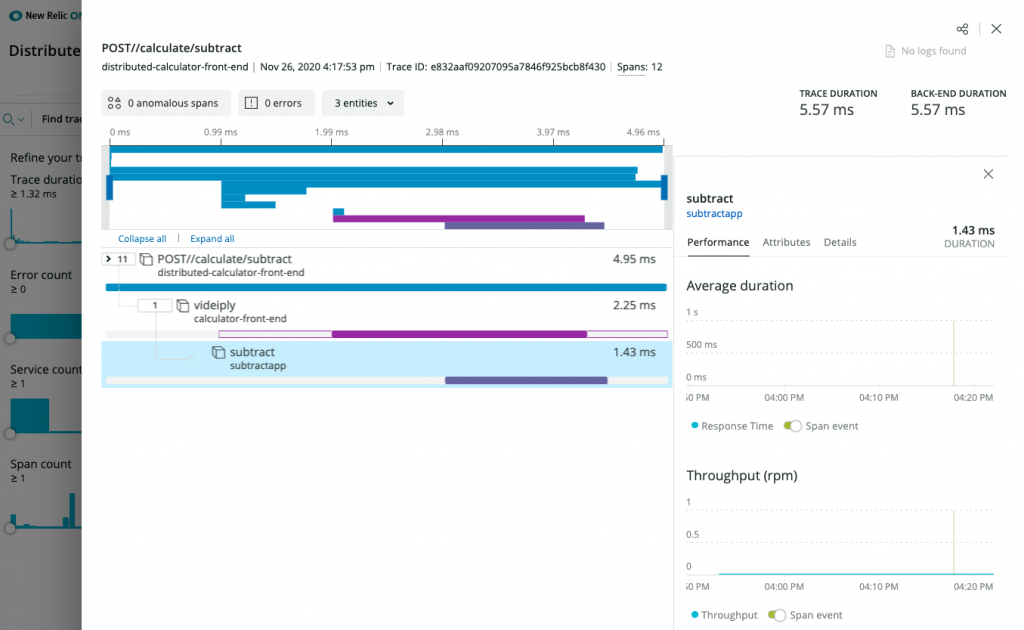
Distributed Tracing
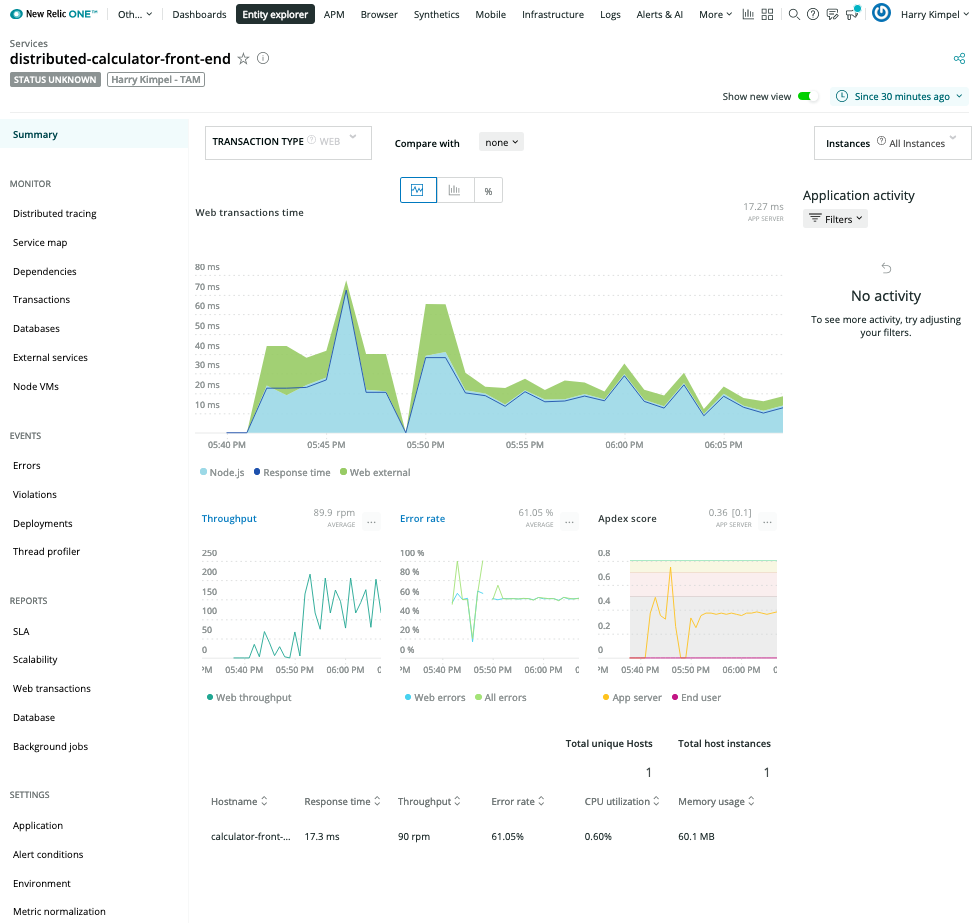
New Relic APM curated experience
Front-end application with New Relic language agent
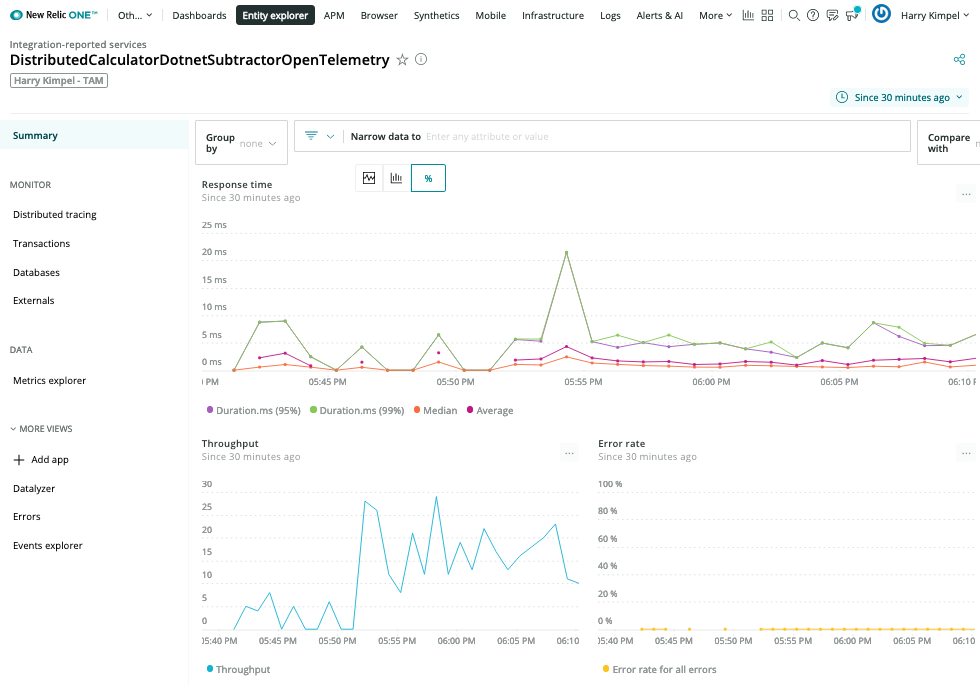
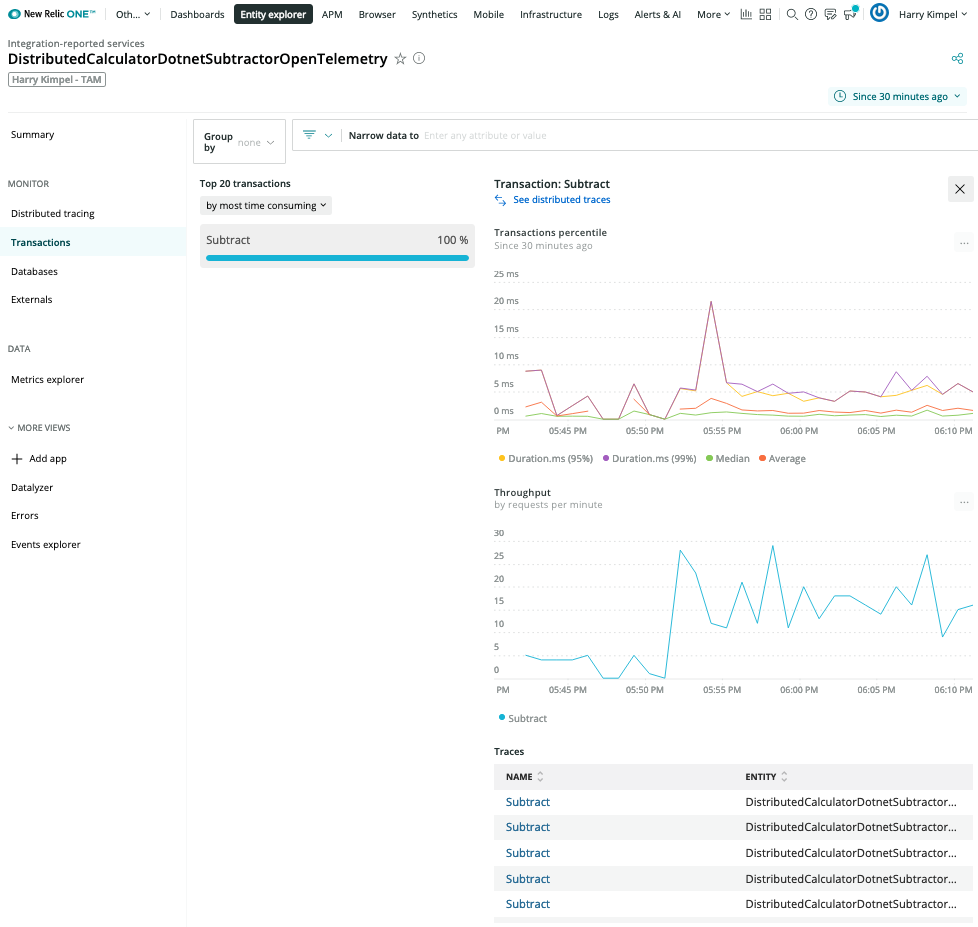
.Net Core Subtractor with OpenTelemetry Exporter
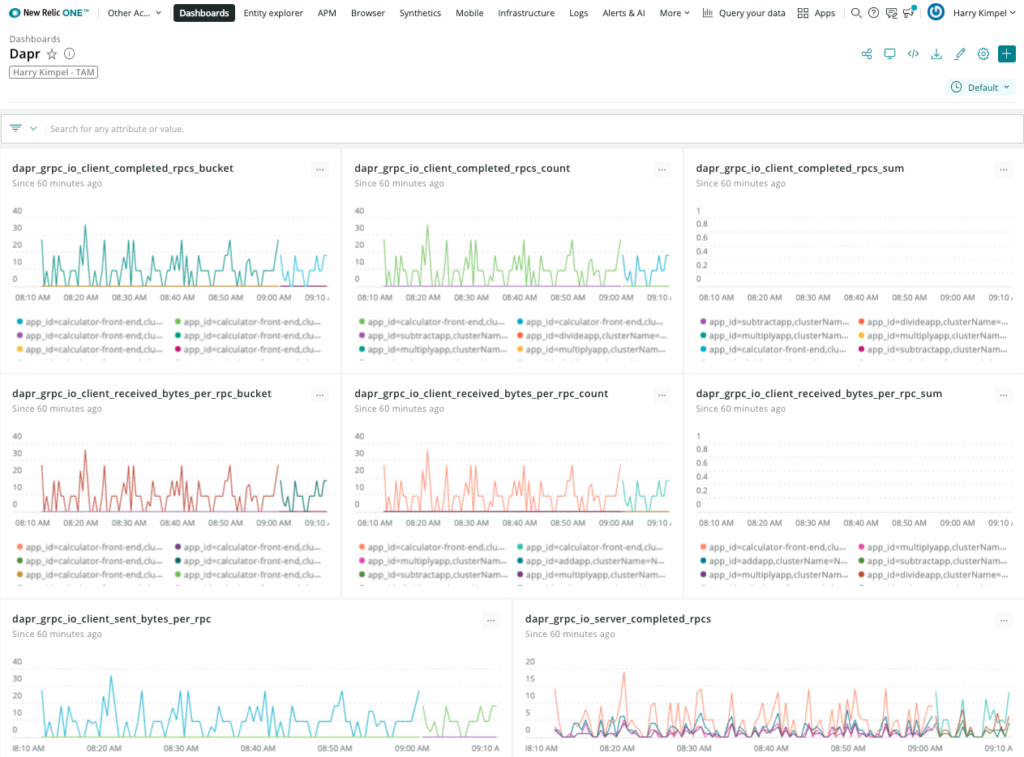
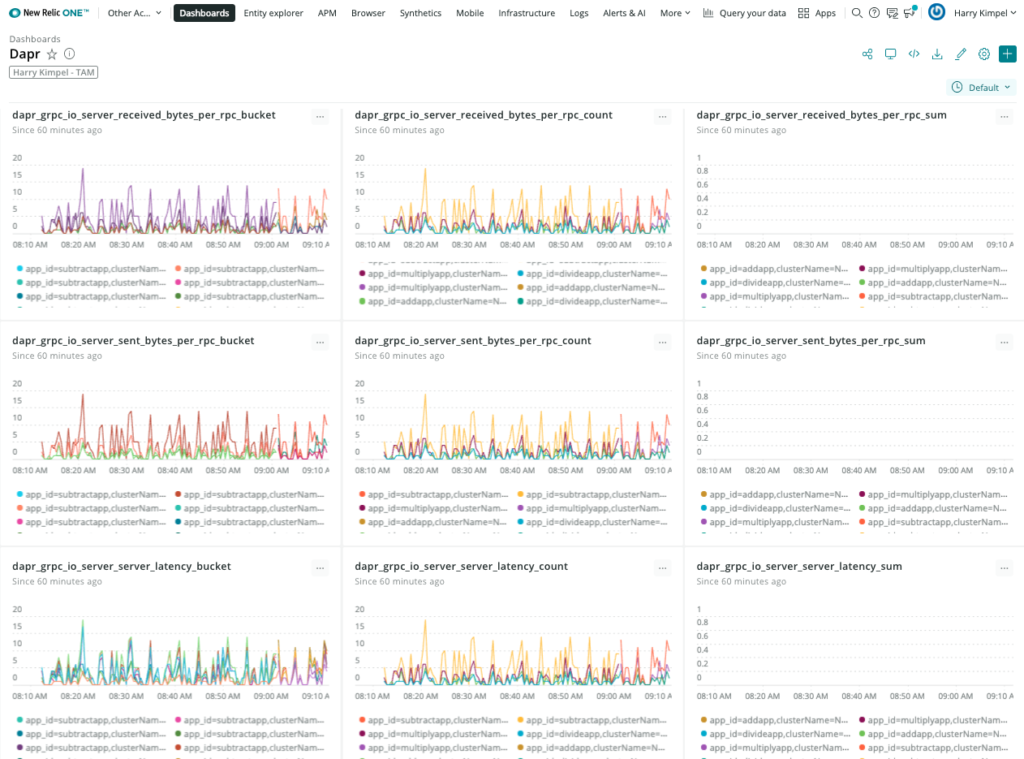
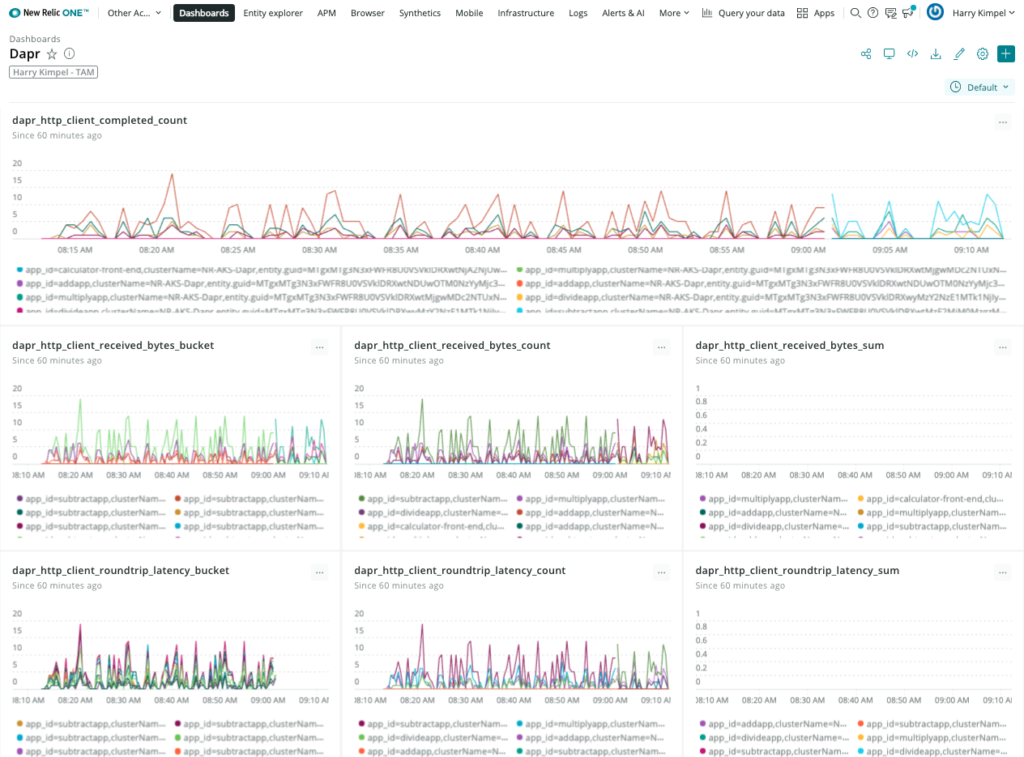
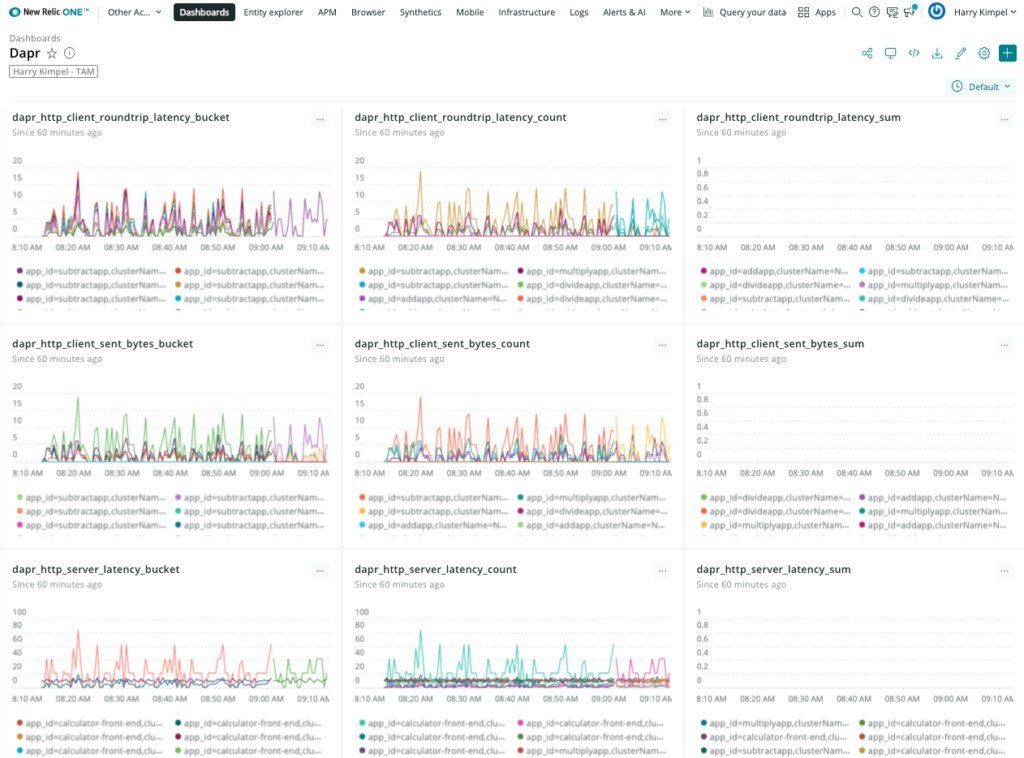
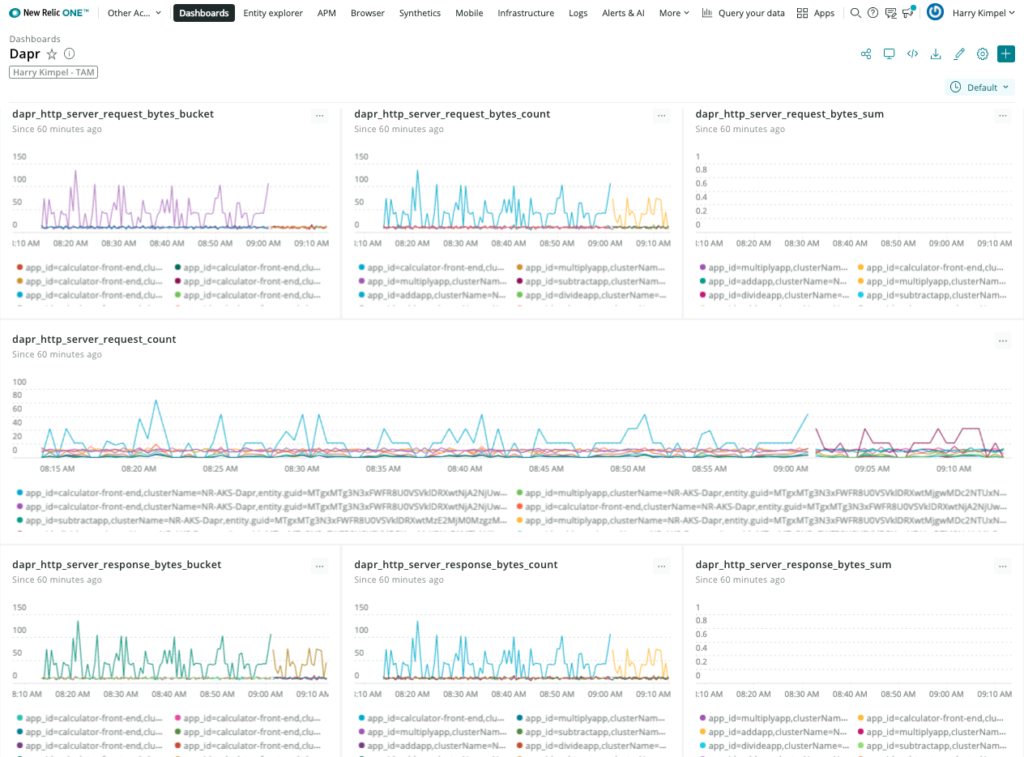
New Relic Dashboards
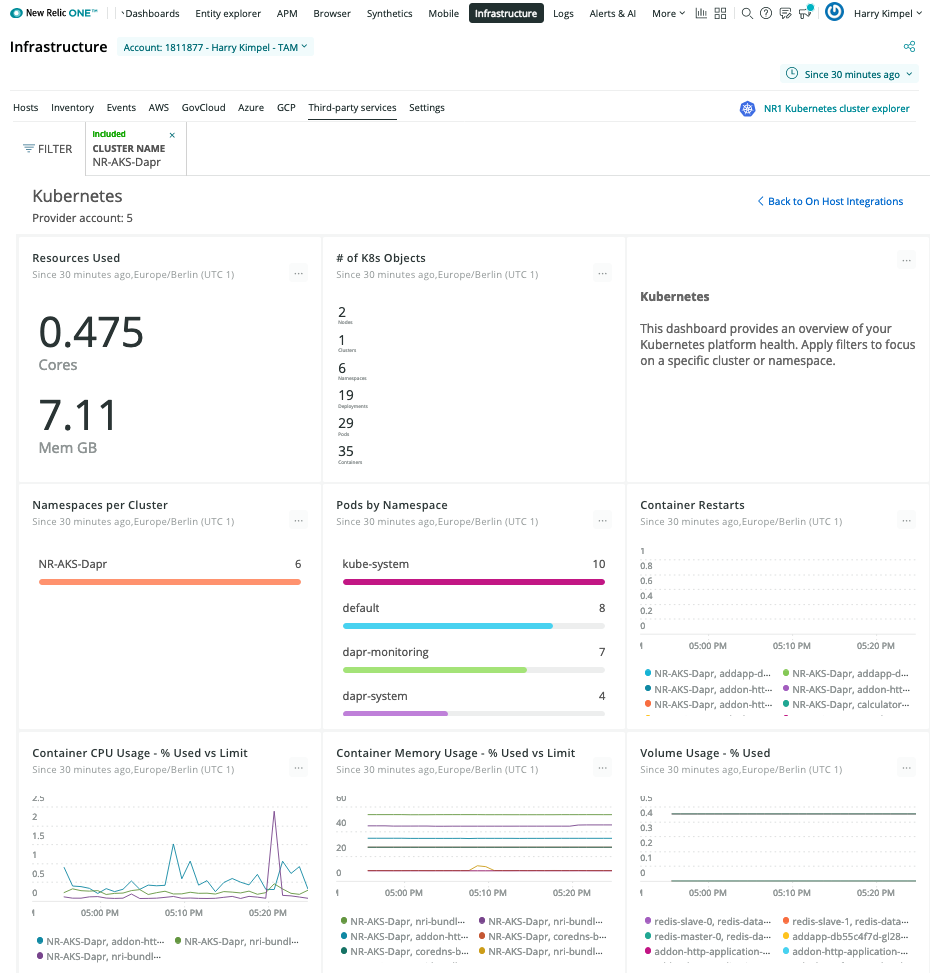
Kubernetes Overview
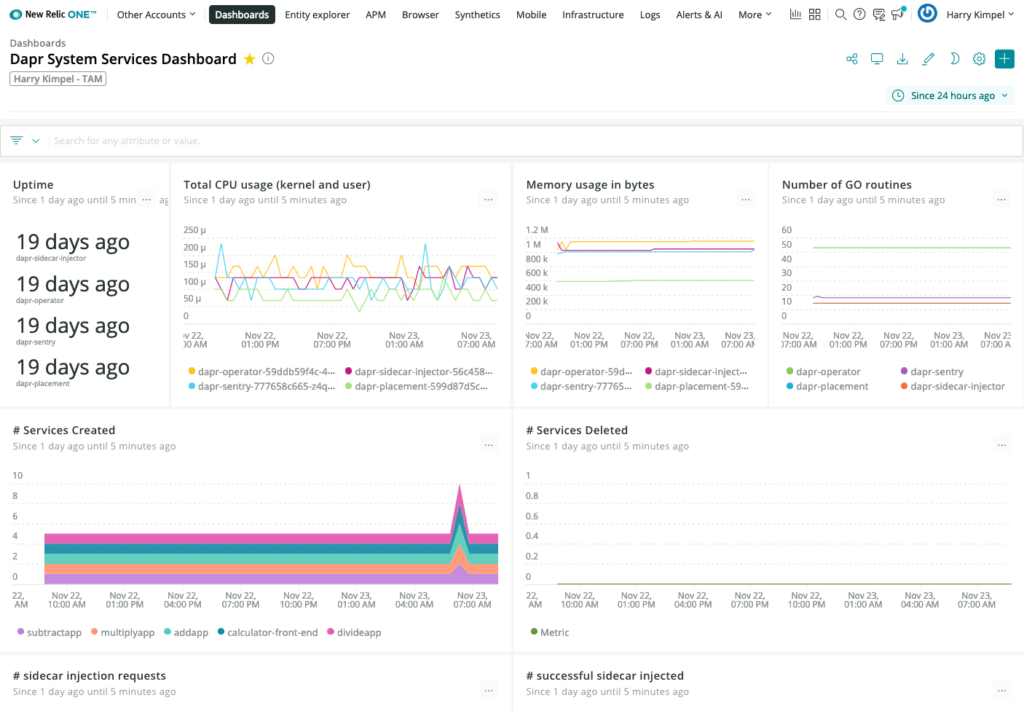
Dapr System Services
Dapr Metrics
New Relic Grafana integration
New Relic teamed up with Grafana Labs so you can use our Telemetry Data Platform as a data source for Prometheus metrics and see them in your existing dashboards, seamlessly tapping into the reliability, scale, and security provided by New Relic.
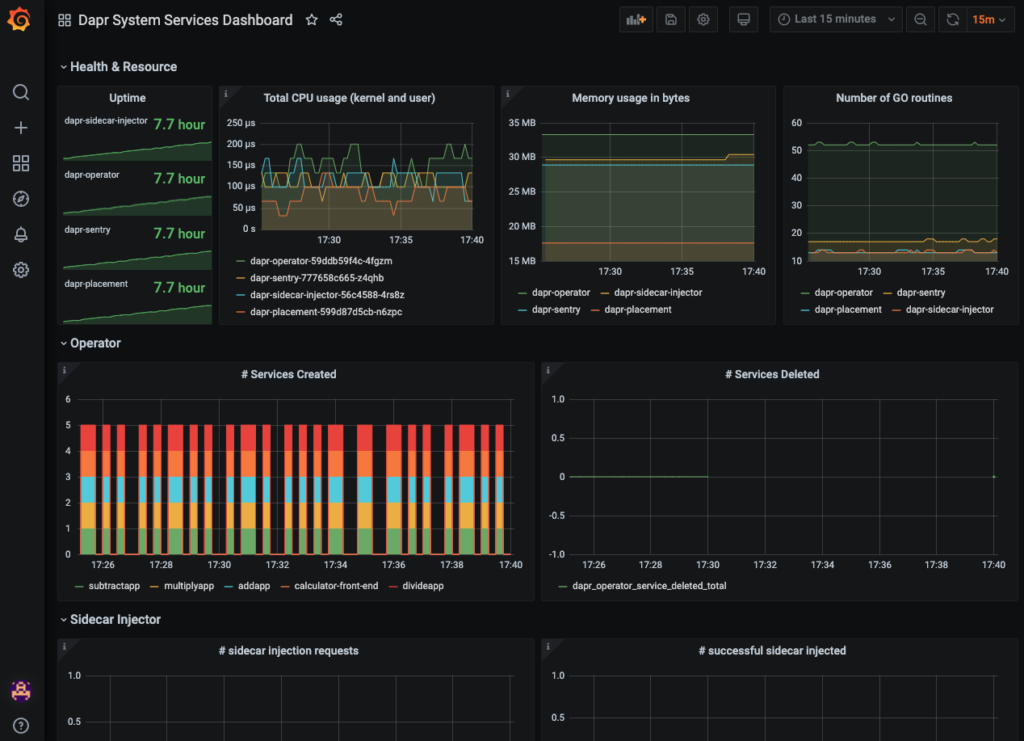
Grafana dashboard templates to monitor Dapr system services and sidecars can easily be used without any changes. New Relic provides a native endpoint for Prometheus metrics into Grafana. A datasource can easily be set-up:
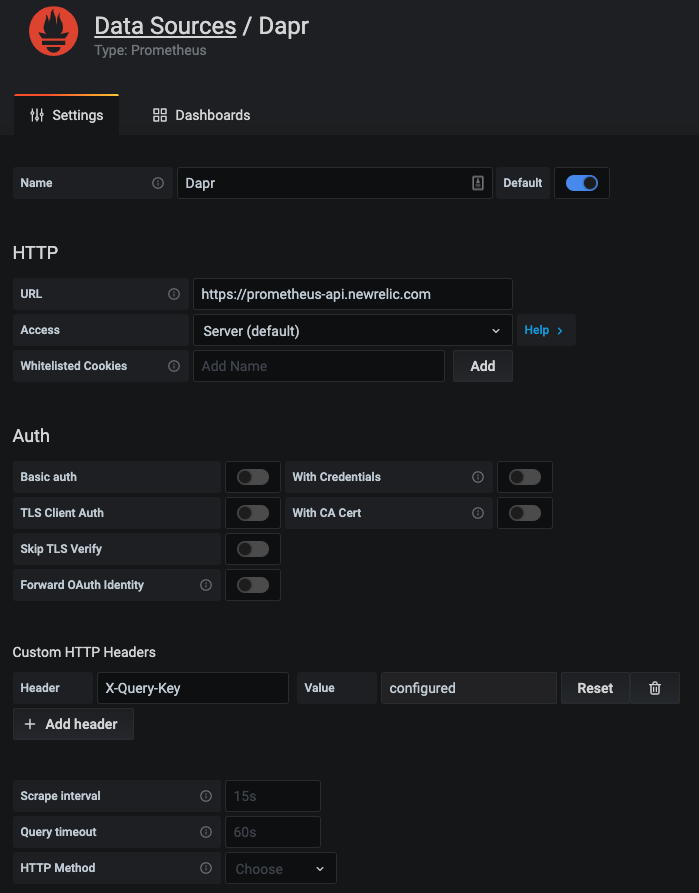
And the exact same dashboard templates from Dapr can be imported to visualize Dapr system services and sidecars.
New Relic Alerts
All the data that is collected from Kubernetes, Dapr or any services that run on top of Kubernetes can be used to set-up alerts and notifications into the preferred channel of your choice.
Related Links/References
- New Relic Account Signup
- Telemetry Data Platform
- Distributed Tracing
- New Relic Trace API
- New Relic Metric API
- Types of New Relic API keys
- New Relic OpenTelemetry User Experience
- Alerts and Applied Intelligence