Below you will find pages that utilize the taxonomy term “Opentelemetry”
How To Observe Your Blazor WebAssembly Application With OpenTelemetry And Real User Monitoring
Effortless integration and enhanced visibility with OpenTelemetry in Blazor WebAssembly
Challenges in observing WebAssembly applications
Observing WebAssembly applications presents unique challenges that stem from its design and execution environment. Unlike traditional web applications, where monitoring tools can hook directly into JavaScript and the Document Object Model (DOM), WebAssembly runs as binary code executed within the browser’s sandbox. This layer of abstraction complicates direct introspection, as traditional monitoring tools are not designed to interact with the lower-level operations of WebAssembly. The Bytecode Alliance plays a crucial role here, promoting standards and tools that aim to enhance the security and usability of WebAssembly, including better support for observability. Moreover, the performance characteristics of WebAssembly, which can closely approach native speeds, demand monitoring solutions that are both highly efficient and minimally invasive to avoid impacting the user experience. This creates a complex scenario for developers who need detailed visibility into their applications’ behavior without sacrificing performance.
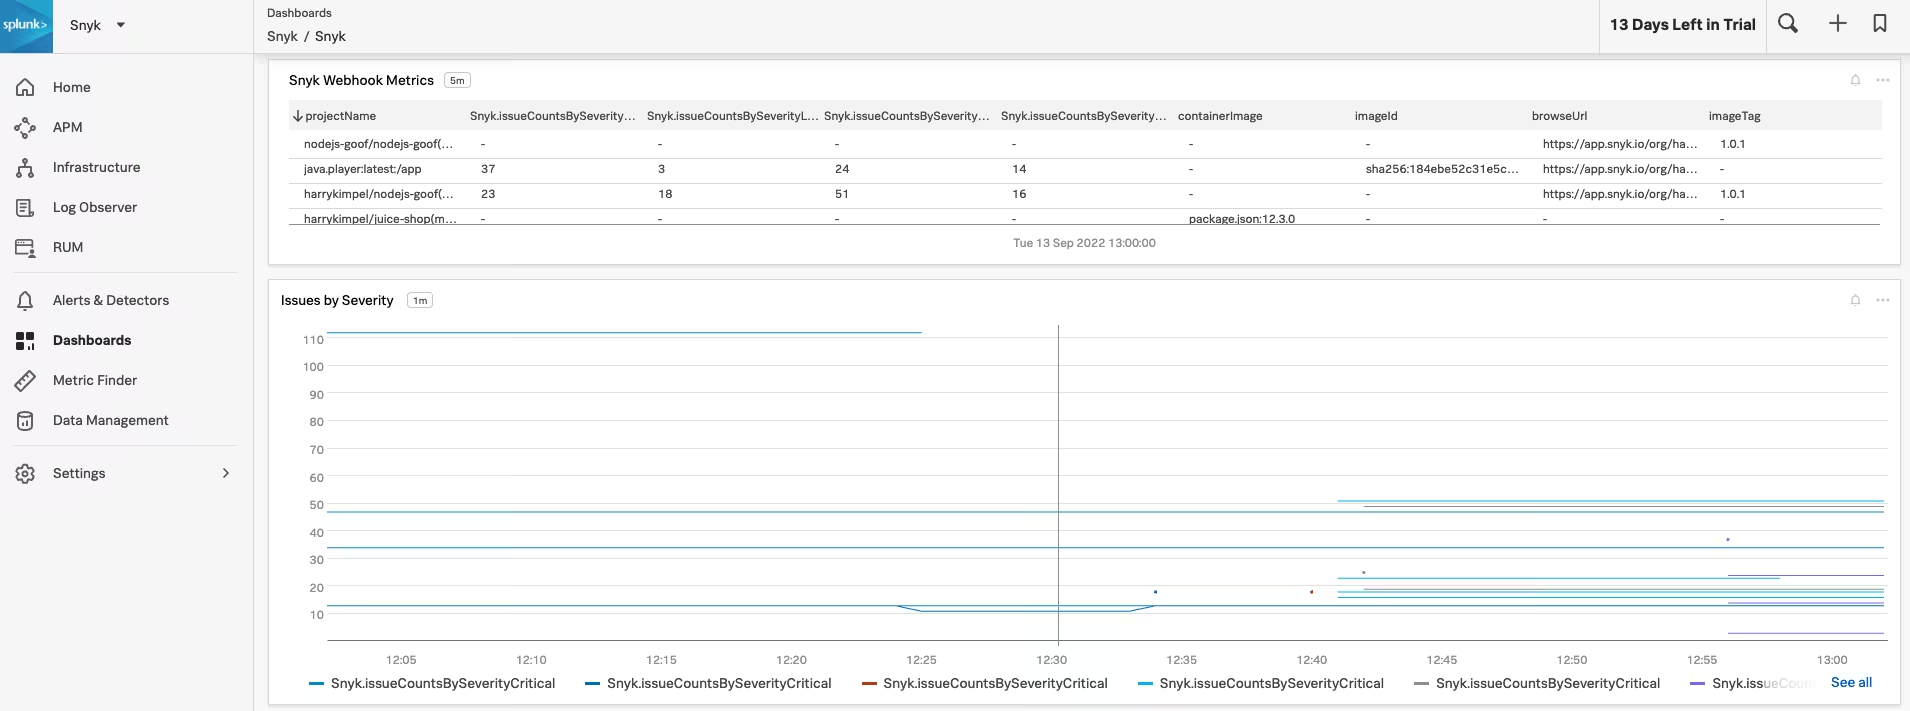
Forward Snyk Vulnerability data to Splunk Observability Cloud
TL;DR
Leverage a Prometheus Exporter to send all your application security vulnerabilities from Snyk into Splunk.
Here are all the necessary links to get started:
- Snyk Exporter: https://github.com/lunarway/snyk_exporter
- Splunk OpenTelemetry Collector for Kubernetes: https://docs.splunk.com/Observability/gdi/opentelemetry/install-k8s.html#otel-install-k8s
Update (2022-09-22)
The option that I am describing here is just one way to achieve this. There might even be a more straight forward option available that I started to describe in a more recent post. Please find an additional approach in my post Snyk Integration Capabilities with WebHooks - some examples.
How-To: Set-up New Relic to observe Dapr and it's applications
How-To: Set-up New Relic to collect and observe metrics, traces and logs from Dapr and the underlying applications.
Enable Dapr metrics and logs with New Relic Kubernetes integration for Azure Kubernetes Service (AKS) and application traces using OpenTelemetry.
Prerequisites
- Azure Kubernetes Service
- kubectl
- An installation of Dapr on Kubernetes
- Perpetually free New Relic account, 100 GB/month of free data ingest, 1 free full access user, unlimited free basic users
Enable New Relic Kubernetes integration
The Kubernetes integration monitors worker nodes. In Azure Kubernetes Service, master nodes are managed by Azure and abstracted from the Kubernetes platforms.